Measurement analysis 
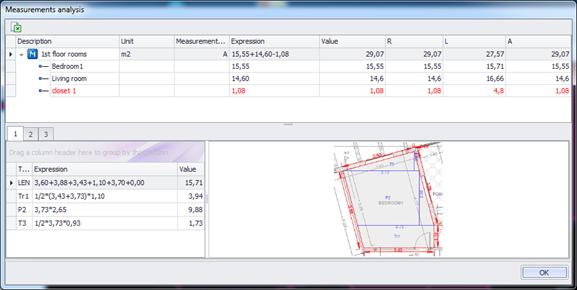
Using this button, the selected measurement’s analysis is viewed. Each sub-measurement appears in a different row, while the main measurement’s values are shown in the first row. The columns display the description (name) of the sub measurement, its unit, measurement type, calculation expression and value. Furthermore the columns L, A and R contain the length, area and primary result of the measurement respectively.
On the lower part of the window there is the detailed calculation of these results, as well as a thumbnail of the region where the sub measurement was performed, divided in basic geometric shapes (See Measurement analysis). Each sub-measurement is displayed in a different tab.
 Each time the continuation of a measurement
(by addition or subtraction) is made, a new sub-measurement is created (See
Drawings/Continue measurement). If a sub measurement was created via the Continue
measurement (subtract)
Each time the continuation of a measurement
(by addition or subtraction) is made, a new sub-measurement is created (See
Drawings/Continue measurement). If a sub measurement was created via the Continue
measurement (subtract)  ,
then it will be colored red.
,
then it will be colored red.
By temporarily
stopping a measurement by pressing the Esc
key once, distinct parts are created in the measurement analysis, which are
distinguished with the use of parentheses in the expression column, e.g. the
measurement of the baseboard with gaps in the place of doors.
 Export to Excel