Send To Excel
The Send To Excel option will ask the user if they desire to have the k-ratio and matrix correction calculations output to an Excel spreadsheet. The output data can be utilized for a number of purposes but is primarily intended to allow the user to estimate the contribution of secondary fluorescence from a boundary phase. The column labels are as follows:
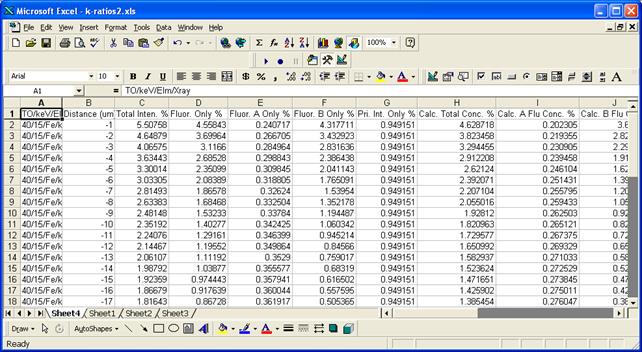
TO/keV/Elm/Xray The takeoff, keV, element and x-ray calculated
Distance (um) The linear distance from the boundary in microns
Total Inten. % The total intensity emitted from A and B in % relative to the standard
Fluor. Only % The total fluorescence from both material A and material B
Fluor. A Only % The fluorescence intensity (characteristic and continuum) from A only
Fluor. B Only % The fluorescence intensity (characteristic and continuum) from B only
Pri. Int. Only % The primary intensity in % from electron excitation relative to the standard
Calc. Total Conc. % The “calculated” concentration assuming the matrix correction from matrix A
Calc. A Flu Conc. % The “calculated” concentration of the fluorescent intensity from material A
Calc. B Flu Conc. % The “calculated” concentration of the fluorescent intensity from material B
Calc. Pri. Conc. % The “calculated” concentration of the primary intensity from A and B
Meas. Total Inten. % The “measured” concentration of the fluorescent intensity from material A
Meas. ZAF The bulk matrix correction utilized by CalcZAF or Probe for EPMA
Meas. Total Conc. % The “measured” concentration assuming the bulk matrix correction from CalcZAF
Actual A Conc. % The actual concentration in material A
Actual B Conc. % The actual concentration in material B
Actual B Std Conc. % The actual concentration in material B Std
ZA u/s (Fanal) The absorption-atomic number matrix correction only from Fanal
Flu u/s (Fanal) The fluorescence correction only from Fanal
ZAF u/s (Fanal) The full matrix correction from Fanal k-ratios
ZA u/s (CalcZAF) The absorption-atomic number matrix correction only from CalcZAF
Flu u/s (CalcZAF) The fluorescence correction only from CalcZAF
ZAF u/s (CalcZAF) The full matrix correction from CalcZAF k-ratios
A Abs (CalcZAF) The CalcZAF absorption correction for material A
A Flu (CalcZAF) The CalcZAF fluorescence correction for material A
A Zed (CalcZAF) The CalcZAF atomic number correction for material A
A ZAF (CalcZAF) The CalcZAF matrix correction for material A
B Abs (CalcZAF) The CalcZAF absorption correction for material B
B Flu (CalcZAF) The CalcZAF fluorescence correction for material B
B Zed (CalcZAF) The CalcZAF atomic number correction for material B
B ZAF (CalcZAF) The CalcZAF matrix correction for material B
B Std Abs (CalcZAF) The CalcZAF absorption correction for material B Std
B Std Flu (CalcZAF) The CalcZAF fluorescence correction for material B Std
B Std Zed (CalcZAF) The CalcZAF atomic number correction for material B Std
B Std ZAF (CalcZAF) The CalcZAF matrix correction for material B Std
Distance (ug/cm2) Mass distance in micrograms per square centimeter
In general, the user should subtract the elemental weight percent concentration reported by Probe for EPMA from the “Meas. Total Conc. %” in column L to obtain the actual fluorescence contribution from the presence of the boundary phase. These values can then be subtracted from the elemental weight percent concentration reported from Probe for EPMA to perform a boundary fluorescence correction assuming that appropriate densities were assumed in the material files and proper boundary distances were calculated.
Note that this is only a first order boundary correction since the matrix correction should then be recalculated after subtraction, but for correction of trace and even minor element concentrations the calculation will be very accurate. Eventually Probe for EPMA will incorporate this boundary fluorescence correction rigorously into the matrix iteration where the contribution from the boundary phases will be iteratively corrected for a full quantitative treatment.