Polygon Grid
The Polygon Grid dialog allows the user to digitize an offset grid of points which is delimited by an arbitrary boundary digitized by the user. This boundary may contain any number of points and is saved along with the grid points for use in exporting to a .BLN boundary file used to create SURFER 3-D surface and/or contour output.
To create a boundary for the polygon grid, use the focused reflected light and/or BSE image to simply move the stage and then click the Add Polygon Boundary Coordinate button for each position to be included in the boundary. Depending on the desired level of detail, any number of coordinates may be used to digitize the boundary feature.
The boundary can be plotted during the digitization process by clicking the Plot Polygon Boundary button and the first and last points are automatically assumed to be closed to complete the polygon boundary. Because the grid algorithm is quite robust, boundaries of any arbitrary shape may be digitized.
The Test button is only visible in demonstration mode and is used to load a default polygon to demonstrate the polygon gridding process.
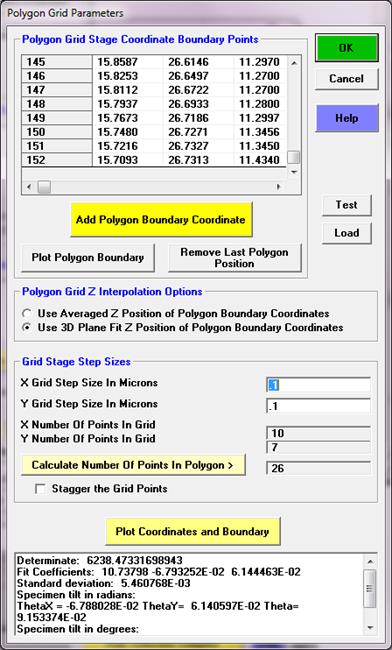
The Load button is used to load a previously digitized set of polygon grid boundary coordinates. This is useful when the user decides that a different grid spacing is preferred but with the same digitized boundary. By using this feature, the user is not required to re-digitize the boundary coordinates. Typically, one should create a new position sample (with no positions) when loading a previously digitized polygon boundary for the purpose of changing the grid step sizes.
Two methods for determining the Z axis interpolated position are available. The first is based on the average Z position of all boundary positions, the second is a 3-D plane fit to the Z position of all boundary positions.
Adjust the number of points to be gridded during the digitization by entering X and Y grid step sizes in microns. For example, a 100 x 100 micron rectangle (4 boundary points) will produce 121 analysis positions if a 10 micron spacing is used for both X and Y (11 by 11).
The program will prompt the user if the number of grid positions are excessively large by assuming a "rectangular" boundary. To see the actual number of grid points that will fit inside the digitized boundary, click the Calculate Number of Points in Polygon button to determine the actual number points that will be digitized.
Click OK when ready to digitize the grid based on the polygon boundary coordinates and the X and Y grid step sizes. Click Cancel to not digitize any polygon grid positions and not save the boundary coordinates.
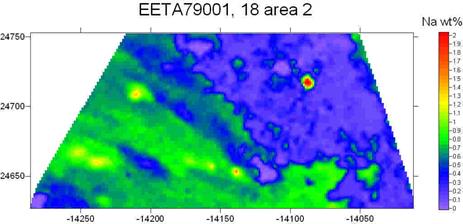
An example of the type of output that is obtained when the polygon grid quant data is exported from the Plot! Window using the “SURFER .BAS File” checkbox (first click the “Send Data To ASCII File” option) and the resulting .BAS script is run from the Golden Software Scripter applet is shown here: