MAN Backgrounds
There are three methods for performing a background measurement acquisition for WDS x-ray intensity data. The method most familiar to many microprobe users is the Off-Peak background method. Probe for EPMA uses this method, also a new Multi-Point off-peak background correction and another called the Mean Atomic Number (MAN) background correction.

This latter method is based on the fact that most of the background (continuum) production in a sample is directly proportional to the average atomic number of the sample. If the average atomic number of the sample is low (for example, silicates) and the peak to background ratio is high, then the MAN background correction method works quite well down to minor element concentrations, since the total background is often less than one standard deviation of the peak intensity of the characteristic x-ray signal.
The advantage of the MAN method is that it requires only a simple calibration of the analyzing channel over a range of atomic number that includes the atomic number range of the standards and samples. If many samples are to be measured for their major and even minor element concentrations, then substantial time may be saved using the MAN method.
However, if measuring high average atomic number samples (greater than, for example, silicates) and/or trace concentrations, one will need to use the off-peak background correction method. See below for more on off-peak background corrections.
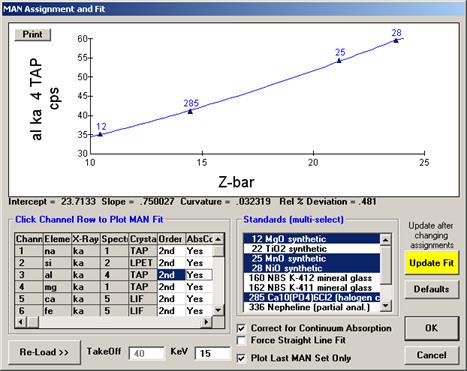
The Mean Atomic Number (MAN) background correction is an empirical calibration curve correction for background. Probe for EPMA uses an iterated linear or polynomial fit of up to 16 background measurements to provide quantitative correction over a wide range of sample atomic numbers.
The technique is based on the fact that background is essentially a function of the average atomic number of a sample often referred to as "Z-bar". You can determine the Z-bar of any composition by using the "data" command in program Standard to print out a standard composition. You can of course also create a dummy composition for reference purposes and delete it later, or simply view the average atomic number values for standards with a similar composition to the one of interest in Standard.
The program uses a graphical display of the measured counts on the background standards versus their Z-bars for each analyzed element to allow the user to select individual points for the calibration curve. Once the curves are fit the program can then calculate the background of any sample during the ZAF iteration based on the composition of the sample for a quantitative background correction.