Plot
The Plot button will display the digitized X and Y stage coordinates for the selected position sample. Multiple samples can be plotted at the same time.
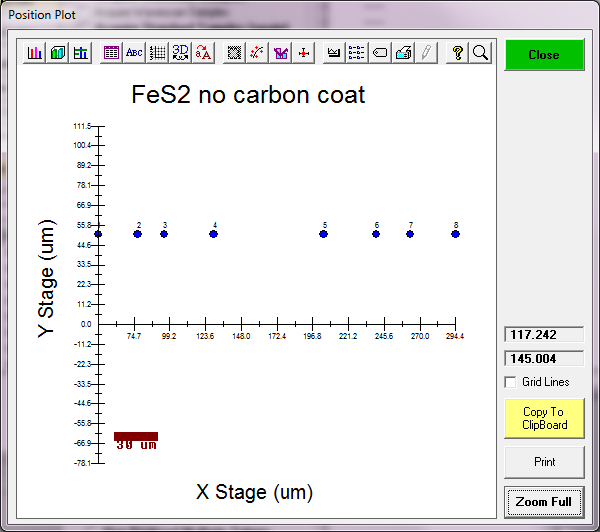
The example above shows a plot of a Polygon grid consisting of 55 points digitized using three boundary points.
If the position sample is a polygon gridded position sample then the digitized polygon boundary will also be displayed. The coordinates of the cursor are displayed as the cursor is moved across the plot area.