|
From the View menu of PicoLog Recorder or Player, select XY Graph.
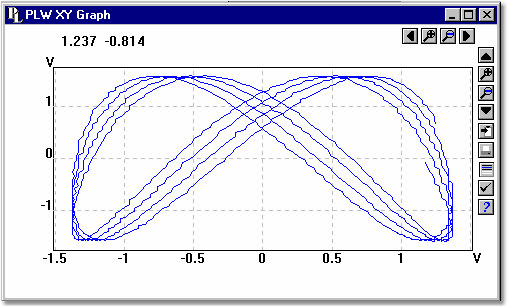
There are several buttons in the top right corner of the screen. The top row of buttons controls the horizontal range displayed:
 | Scroll quarter left. Move a quarter display left. |
 | Expand horizontal axis. Magnify the middle half of the display to fill the whole width. |
 | Shrink horizontal axis. Shrink the current display to half size, so that more is displayed. |
 | Scroll quarter right. Move a quarter display right |
The upper group of buttons in the column on the right controls the vertical range displayed:
 | Scroll up. Move a whole display up. |
| Expand vertical axis. Magnify the middle half of the display to fill the whole height. |
| Shrink vertical axis. Shrink the current display height to half size, so that more is displayed above and below. |
 | Scroll down. Move a whole display down. |
Note that if you use these controls to change the horizontal or vertical range, auto-scaling for that axis is turned off automatically. Use the options to turn auto-scaling back on again (see buttons below).
The remaining vertical controls are:
 | Copy to clipboard. Copy the graph to the clipboard. |
 | Print view. Print the graph. |
 | Select channels. Select the measurements to display on the XY graph (only two). |
 | View options. Specify the options for the graph. |
 | Help. Access the help info for the graph window (this page). |
If you move the mouse cursor onto the graph part of the screen, the computer will display the measurement values at the current cursor position.
| 

