|
Spreadsheet options |


|
|
To access this dialog box, click
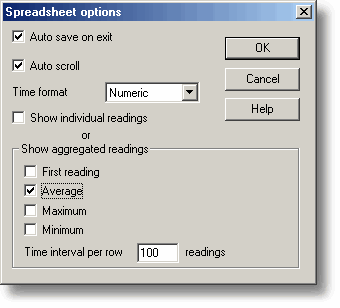
Auto save on exit. When this box is checked, all event window settings are saved automatically when you close the event window. Auto scroll. When auto scroll is enabled whilst sampling is in progress, the windowed range is updated automatically to keep the latest reading visible. Time Format. This allows you to choose the format for the time:
Show individual/aggregated readings. When Show individual readings is checked, the spreadsheet window shows each individual reading. When the box is cleared, the computer displays results which are aggregates (1st reading/average/maximum/minimum) of the readings for the time interval specified below. The controls in the Show aggregated readings box are then enabled. If you select more than one control, the computer displays the corresponding number of columns for each sensor in the spreadsheet, and adds a heading (1st reading/average/maximum/minimum) to each column. Time interval per row. This specifies the time interval between each of the rows on the spreadsheet. If, for example, the sampling interval was set for every minute, and you set the time interval per row to 60, each row will be the (1st reading / average / maximum / minimum) of 60 readings. |