|
Colours |


|
|
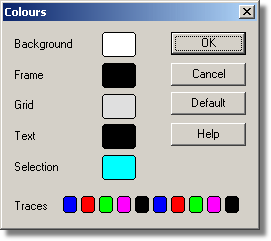
To access this dialog box, select Colours from the Preferences submenu in the File menu.
This is used to specify the colours for the background, text and traces for the graph and spreadsheet windows. To change a colour, click on the colour button to open the colour selection dialog box. Background. This is the colour for the background on graphs, and for non-selected readings on the spreadsheet. Frame. This is the colour of the frame around graphs. Grid. This is the colour for the grid on the graphs. Text. This is the colour for text. Selection. This is the colour for the selected readings on the spreadsheet. Traces. A graph can display up to ten traces: the ten buttons along the bottom of the dialog box are the colours for each trace. |
