|
From the View menu of PicoLog Recorder or Player, select Graph.
Note that there are several graph options that affect the way that the graph is displayed and the format of the axis scales.
The group of horizontal buttons in the top right corner of the screen selects what time interval is displayed:
 | Scroll left. Move a whole display left. |
 | Scroll quarter left. Move a quarter display left. |
 | Expand horizontal axis. Magnify the middle half of the display to fill the whole width. |
 | Shrink horizontal axis. Shrink the current display to half size, so that more is displayed before and after. |
 | Scroll quarter right. Move a quarter display right. |
 | Scroll right. Move a whole display right. |
The upper group of vertical buttons controls the vertical range displayed. If there is more than one graph frame, the buttons control the frame with the thicker border. To switch to a different frame, point inside the new frame with the cursor and click the left mouse button.
 | Scroll up. Move a whole display up. |
| Expand vertical axis. Magnify the middle half of the display to fill the whole height. |
| Shrink vertical axis. Shrink the current display height to half size, so that more is displayed above and below. |
 | Scroll down. Move a whole display down. |
Note that if you use these controls to change the time or vertical range, auto-scaling for that axis is turned off automatically. Use the options to turn auto-scaling back on again (see button below).
The remaining vertical controls are:
 | Copy to clipboard. Copy the graph to the clipboard. |
 | Print view. Print the graph. |
 | New file. Write graph to file in .bmp, .jpg, or .wmf format. |
 | Help. Access the help info for the graph window (this page). |
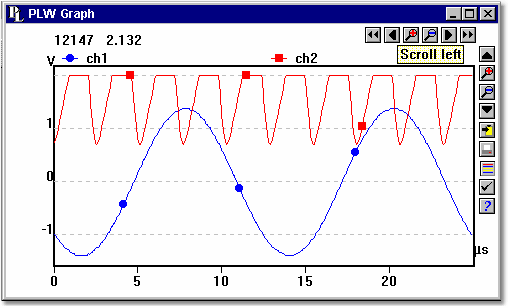
If you move the mouse cursor onto the graph part of the screen, the computer will display the measurement value and time at the current cursor position. If you click the left mouse button, the graph will zoom in, centred on the mouse cursor. If you click the right mouse button, the graph will zoom out, centred on the mouse cursor.
| 


