|
From the View menu of PicoLog Recorder or Player, select Spreadsheet.
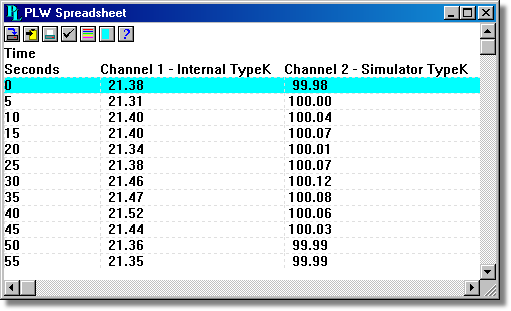
There is one line for each reading. The first column shows the time in seconds, while the remaining columns show the selected measurements.
The following options buttons are available:
 | Select channels. Select the measurements to display. |
 | View options. Spreadsheet options specify whether to display individual readings, or first reading, average, minimum and maximum for a period. |
If you select a range of readings, you can use the following buttons:
 | Write to disk. Write the readings to a print file (.prn) or a text file (.txt) - Both are tab separated value files. |
 | Copy to clipboard. Write the readings to the clipboard. |
 | Print view. Print the graph. |
You can select a range in one of three ways:
If all of the readings that you want to select are on the screen:
 | Point the mouse at the first reading |
| Press and hold down the left mouse button |
| Drag the mouse to the last reading (the selected readings will be highlighted as you go) and |
| Release the left mouse button. |
If the readings are a long way apart:
| Point the mouse at first reading |
| Click the left mouse button (this will highlight the first reading) |
| Scroll down to the last reading |
| Point at the last reading and |
| Press the shift key and click the left mouse button. |
If you wish to select all of the readings for one day:
| Point the mouse at any reading during the required day |
| Click the left mouse button (this will highlight the reading) and |
| Click on the 'select day' icon:  |
| 

