|
Graph options |


|
|
To access this dialog box, click
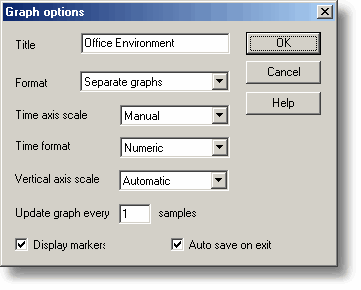
This dialog box is used to set the options for the Graph window. Title. This is the title of the graph that will appear on the graphical reports. Format. This specifies how traces are to be divided between graphs. The choices are:
Time axis scale. This allows you to choose how the time axis is scaled:
The time axis scale is automatically set to Manual if you click any of the time scrolling buttons. Time Format. This allows you to choose the format for the time axis:
Vertical axis scale. This allows you to choose how the vertical axis is scaled:
The Vertical axis scale is automatically set to Manual if you click any of the vertical scrolling buttons. Display every xxx samples. If you are displaying a graph while collecting data, this controls how frequently the graph is updated. It has no effect after you have finished recording, or when using the player. When collecting fewer than a thousand samples, leave it set to 1. When collecting a large number of points, it may take some time to update the graph, so updating every time a new reading is taken would be a waste off effort. Display Markers. When this box is checked and there is more than one trace on the graph, the computer displays markers (triangles, circles etc) on the traces to help identify the traces. Auto save on exit. When this box is checked, all graph window settings are saved automatically when you close the graph window. |