Quantal Analysis of Transmitter Release > Analysing Quantal Content of Synaptic Currents
The following procedure can be used to calculate the quantal content of a series of synaptic currents or potentials, which have been recorded and stored in a digitised data file.
a) Using the record display module, inspect each record in the data file and classify it as being either a nerve-evoked signal, EVOK, a spontaneous miniature event, MINI, or (in experiments where the probability of transmitter release is low) a nerve stimulus which has failed to release any quanta, FAIL. (You should also mark any records containing artefacts as REJECTED.).
b) Use the waveform measurements module to calculate the waveform parameters for ALL of the records, with the intention of measuring the signal peak amplitude (Take care to exclude the nerve stimulus artefact).
c) Select
Analysis
Quantal Content
to open the quantal analysis window.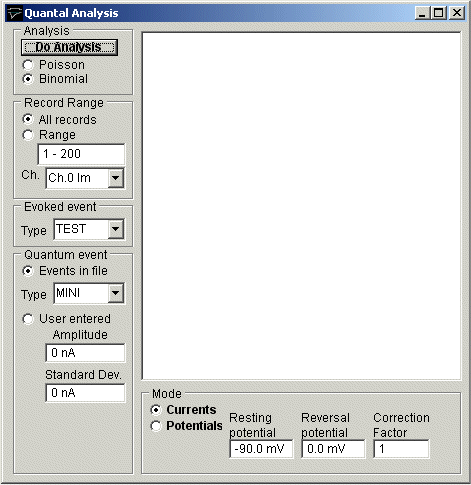
To calculate the quantal content of the synaptic currents:
1) Select the type of quantal analysis. Choose Poisson if there are no MINI records available and the transmitter release probability is expected to be low. Otherwise choose Binomial.
2) Enter the range of records to be used in the analysis. Select All records if you want to use all records in the file, or select Range and enter a range of records.
3) If there are several channels in the signal record, select the channel which contains the signals to be analysed, from the Ch. list.
4) Evoked events. Select the EVOK record classification type, used to indicate stimulus-evoked signals, from the Type list.
5) Quantum events.If the file contains miniature events, select the Events in file option and select MINI from the Type list.
If there are no miniature events in the file, but you know what the quantal signal amplitude is, select User entered and enter the average peak amplitude of the spontaneous miniature signal into the Amplitude box, and the standard deviation of peak amplitude in the Standard Dev. box
6) Analysis mode.
If the signals being analysed are currents, recorded under voltage-clamp conditions, select the Currents option.
If the signals are potentials, select the Potentials option, and enter the cell resting potential and the reversal potential of the synaptic conductance into the Resting potential and Reversal potential boxes. This data is used to apply a correction for the non-linear summation effect. The Correction factor should be left at the default value (1) unless the appropriate factor for the synapse under study is known.
7) Click the Do Analysis button, to begin the quantal analysis.
The analysis procedure scans through the data file, calculates the mean and variance of the peak amplitude of the signal records, uses these to obtain estimates for the quantal content, and displays the results in the report window. A copy of the quantal analysis report is also written to the log file.
(Note that you can test the operation of the quantal content analysis module using simulated endplate currents or potentials, generated by the synaptic signal simulation module.)