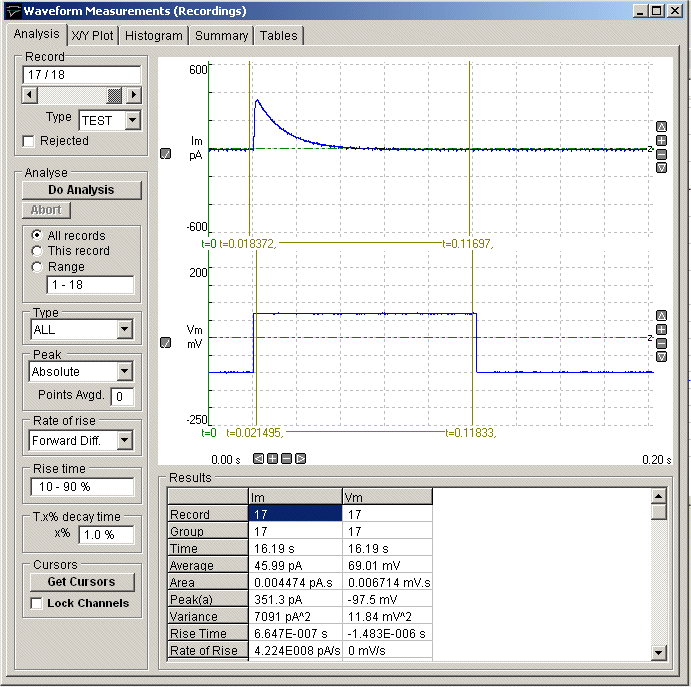
Automatic Waveform Measurement > Making Waveform Measurements
The automatic waveform measurement module provides a means of automatically making series of standard measurements on the digitised signals. Ten basic amplitude and duration measurements can be made on each channel and stored with each record. The results for each record are displayed on screen. In addition, sets of measurement variables can be plotted against each other, or compiled into histograms. A summary report showing mean value and standard errors for the measurement sets can also be produced.
Select
Analysis
Measure Waveforms
to open the automatic waveform measurement window

· The Analysis page is used to set up the parameters of the waveform analysis and initiate the automatic measurement sequence, which generates a table of measurements.
· The X/Y plot page is used to create X-Y graphs of the measurements.
· The Histogram page is used to create frequency histograms of measurement.
· The Summary page presents a summary (mean, standard deviation, etc.) of the measurements for the series of records analysed.
· The Tables page is used to create tables of results.