Recording Experimental Signals > On-line Analysis
The on-line analysis window allows a series of measurements (signal level at cursor, average, peak amplitude, 10-90% rise time and maximum rate of rise) to be made on the waveform recorded during each sweep. A maximum of 10 measurements can be plotted.
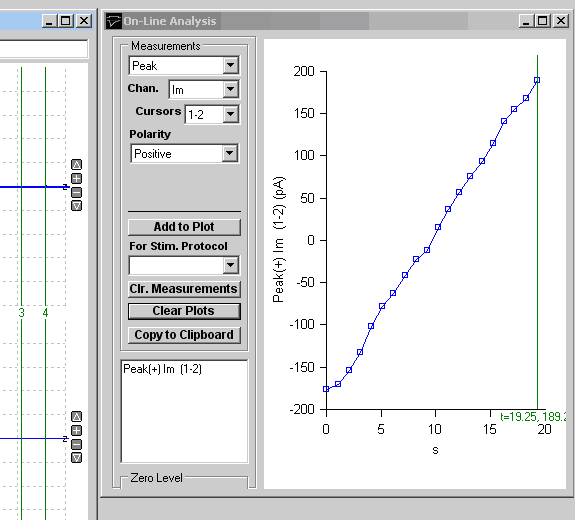
To display the on-line analysis window, click the On-line Analysis Window Open button. It can be closed by clicking the Close button, or closing the On-line Analysis window.
Creating Measurement Plots
 To create a waveform measurement plot, select:
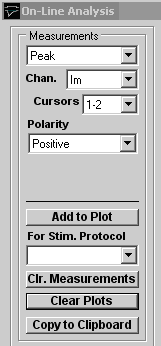
1) The type measurement from the Measurements list,
2) The recording channel to be measured from the Chan. list
3) For peak, rise time, rate of rise and slope: the cursor pair (C1-C2 or C3-C4) defining the analysis region from the Cursors list and the polarity of the signal (positive-going, negative-going or absolute (both positive- and negative-going)) from the Polarity options.
4) For Cursor 1, 2, 3 or 4: enter the number of points averaged about the measurement point into Points Avgd.
5) For rate of rise: the series of samples points (1, 5, 7) used to computer a smoothed rate of change into Smoothing.
6) Optional. The stimulus protocol associated with the measurement in the For Stim Protocol list. (When a stimulus protocol is selected, measurements are only added to the plot when the protocol is running.)
Then click the Add to Plot button.
To erase the measurements list, click the Clr. Measurements button. To clear the plot (but not the measurement list) click the Clear Plots button. The data in the currently displayed plots can be copied to the Windows clipboard by clicking the Copy to Clipboard button. Waveform measurements are also written to the log file as they are acquired.
Measurement cursors
The two pairs of linked vertical cursors C1-C2 or C3-C4 define the region within the recording sweep where a waveform measurement is made. They should be placed to include the waveform of interest, but exclude any stimulus or other artefacts within the recording sweep.
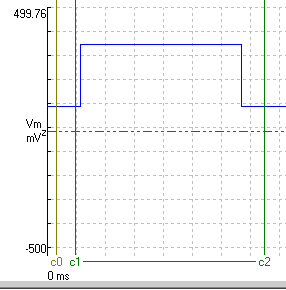
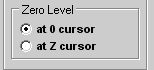 The C0 cursor defines the baseline level preceding the waveform of interest. Peak and C1-C4 cursor measurements are made relative to the signal level at C0 when the at 0 cursor zero level option is selected, OR relative to the ‘z’ horizontal zero level cursor when the at Z cursor option is selected.
Measurements
The available waveform measurements are listed in the table below:
|
Measurements |
|
|
Peak (+), |
Peak positive amplitude within the region of the recording sweep defined by the cursors (C1-C2 or C3-C4). |
|
Rise time (+) |
Time taken for signal to rise within the percentage range of Peak (+), defined in Rise Time Range box (default 10-90%), (The C0 cursor is used indicate the baseline level the signal is rising from and should be placed before the rise of the waveform.) |
|
Rate of Rise (+) |
Maximum rate of change during rise from baseline level to Peak (+). |
|
Rising Slope (+) |
Slope of rising edge of signal within the percentage range of Peak (+), defined in Rise Time Range box (default 10-90%), |
|
Peak (-) |
Peak negative amplitude within the region of the recording sweep defined by the cursors (C1-C2 or C3-C4). |
|
Rise time (-) |
Time taken for signal to rise within the percentage range of Peak (-), defined in Rise Time Range box (default 10-90%), (The C0 cursor is used indicate the baseline level the signal is rising from and should be placed before the rise of the waveform.) |
|
Rate of Rise (-) |
Maximum rate of change during rise from baseline level to to Peak (-). |
|
Rising Slope (-) |
Slope of rising edge of signal within the percentage range of Peak (-), defined in Rise Time Range box (default 10-90%), |
|
Slope |
The slope of a straight line fitted to the region of the recording sweep defined by the cursors (C1-C2 or C3-C4). |
|
Peak (abs) |
Largest absolute value of Peak(+) and Peak(-). |
|
Rise time (abs) |
Time taken for signal to rise from 10% above pre-waveform baseline level to 90% of Peak (abs). (The C0 cursor is used indicate baseline level and should be placed before the rise of the waveform.) |
|
Rate of Rise (abs) |
Maximum rate of change during rise from baseline level to Peak (abs) |
|
Cursor.1 |
Signal level at C1 cursor position, averaged over Points Avgd. points around cursor position. |
|
Cursor.2 |
Average signal level at C2 cursor position, averaged over Points Avgd. points around cursor position. |
|
Cursor.3 |
Average signal level at C3 cursor position, averaged over Points Avgd. points around cursor position. |
|
Cursor.4 |
Average signal level at C4 cursor position, averaged over Points Avgd. points around cursor position. |