Plotting Graphs of Measurements
From WinWCP V5.3.8
Automatic Waveform Measurement > Plotting Graphs of Measurements
The X/Y Plot page can be used to create graphs of the measurements obtained from the analysis run. Any measurement variable from any channel can be plotted against any other as a Y vs X graph. 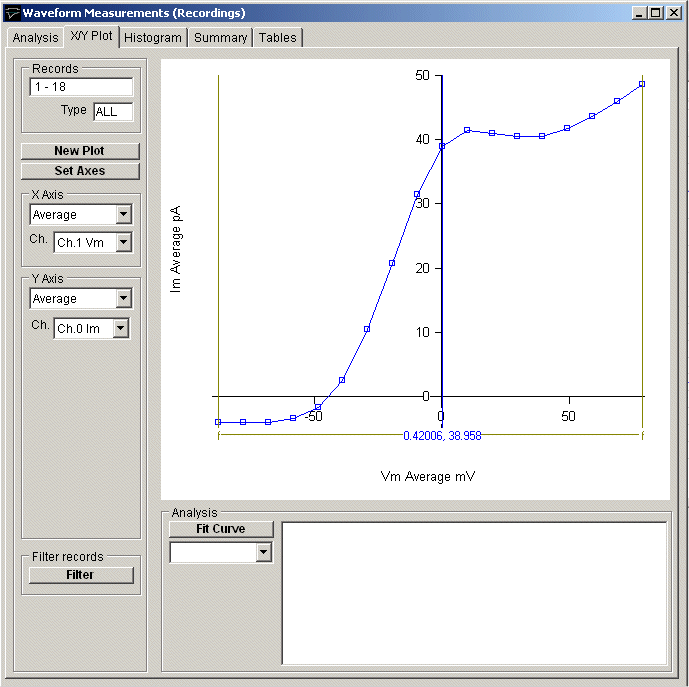
To plot a graph:
1) Select the X/Y Plot page by clicking on its page tab.
2) Define the variable to be plotted on the X axis, by selecting it from the X Axis variable and channel lists.
3) Define the variable to be plotted on the Y axis, by selecting it from Y Axis variable and channel lists.
4) Click the New Plot button to plot the graph.
Conductance plots
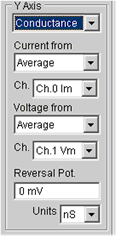
When Conductance is selected as the Y Axis plot variable, the conductance (G) can be computed from a pair of recording channels containing current and voltage using the formula
G = I x (V – Vrev)
where I is the peak or average measurement from the Current from channel, V is the peak or average measurement from the Voltage from channel and Vrev is the current reversal potential, entered into the Reversal Pot. box. The units in which the conductance is plotted (S, mS, uS, nS or pS) can be selected from the Units list.
Customising the graph
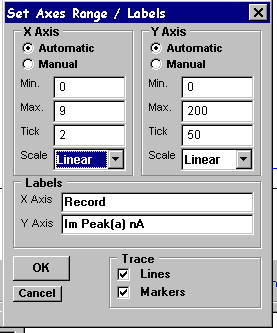
If you want to alter the X or Y axis range, scaling or labels, click the
Set Axes
button to open the Set Axes Range / Labels dialog box.
Axis limits and tick spacing are initially set to default values based upon the range of the data. You can change the axis limits by entering new values for into Min, Max. and Tick (spacing) boxes for the X and Y axes.
An axis can be made Linear or Logarithmic by selecting the option from its Scale list. Labels for the X and Y axes can be entered into the Labels boxes. A type face can be selected for the plot from the Font list and its size defined in the Point Size box. The graph can be plotted as a line, unconnected markers, or both, by ticking the Lines, and/or Markers tick boxes.
Printing the graph
To print the displayed graph, select
File
Print
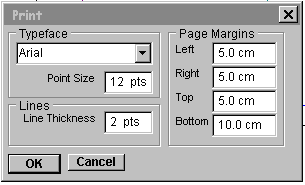
To open the Print dialog box. You can set the size of the graph on the page adjusting the Left, Right, Top and Bottom page margin settings. Click the OK button to plot the graph.
Copying the graph data points to the Windows clipboard
The numerical values of the X,Y data points which generate the graph can be copied to the clipboard by selecting
Edit
Copy Data
The data is placed on the clipboard as a table of X,Y data pairs in tab text format, allowing the data to be copied into programs such as spreadsheets and graph plotting packages, using an Edit/Paste command.
Copying an image of the graph to the Windows clipboard
 An image of the graph on display can be copied to the clipboard by selecting
Edit
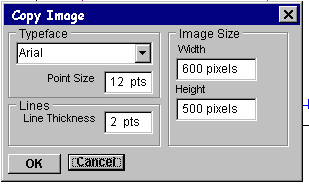
Copy Image
to open the Copy Image dialog box. The dimensions of the bit map, which will hold the image, can be set using the width and height image size boxes. The more pixels used in the bit map the better the quality of the image. When the image parameters have been set, click the OK button to copy the image to the clipboard.