Running a Waveform Analysis
From WinWCP V5.3.8
Automatic Waveform Measurement > Running a Waveform Analysis
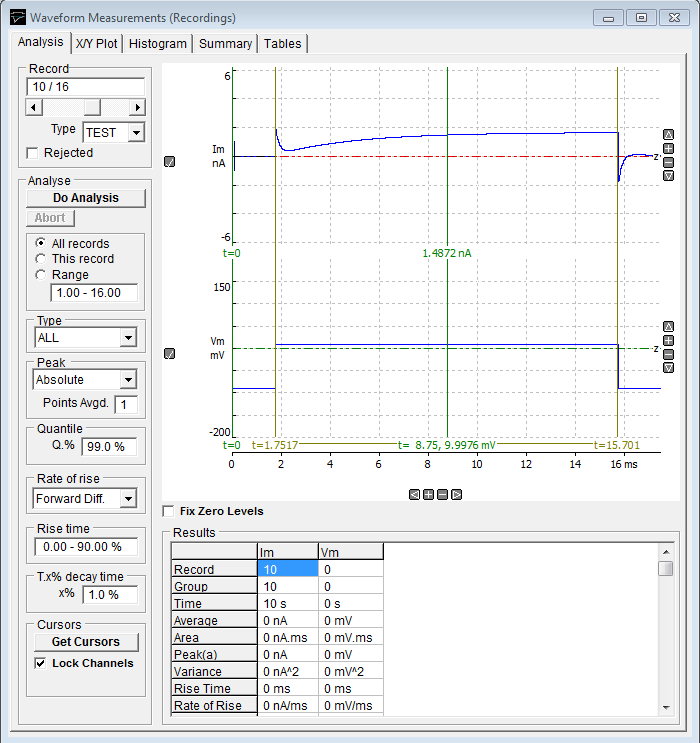
The first stage in the measurement process is to define and run a waveform analysis sequence on a selected series of records.
1) Select the Analysis page by clicking on its page tab.
2) 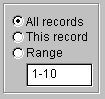 Define the range of records to be analysed, by selecting All Records to analyse all records, or This Record to analyses only the currently displayed record, or Range and enter a range of records.
3) Select the type of records to be measured by selecting an option from the Type list. Select ALL to measure records of any type (except rejected records).
4) Define the analysis region for each channel by using the pairs of linked vertical cursors (t=nn s – t-yy s) superimposed on the display. The analysis region defines the region within the record within which waveform measurements are to be made. (Note. To allow the analysis region to be set for each channel separately, untick the Lock Channels cursor option. The t=0 cursor defines the zero time for the latency measurement.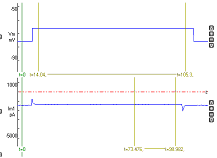
5) 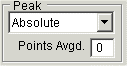 Set the peak finding mode. Select absolute to define the peak value as the largest absolute (i.e. positive or negative) deviation from the record zero level. Select positive to define the peak value as the largest positive deviation. Select negative to define the peak value as the largest negative deviation. (Note. Absolute mode should be used for I/V curve measurements where both positive- and negative-going signals may be found in the sequence of records being analysed.) Enter the number of data points to be averaged at the peak into the Points Avgd. box.
6) 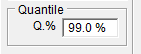 If you want to change the % level of the quantile measurement enter the percentage in the Q% box. <n>% measures the amplitude of the data point that is n% of the maximum data value. 100% returns the maximum value and 0% the minimum value of the signal amplitude points within the analysis region,
7) ![]() If you want the rise time to be measured over an interval other than the standard 10%-90% range, enter a new range in the Rise Time box. (Note that this setting also determines the part of the waveform rising edge used to calculate the slope rate of rise option.)
If you want the rise time to be measured over an interval other than the standard 10%-90% range, enter a new range in the Rise Time box. (Note that this setting also determines the part of the waveform rising edge used to calculate the slope rate of rise option.)
8) ![]() Set the rate of rise mode to select the algorithm used to calculate the rate of change of the signal. The Forward Diff., Quadratic(5), Quadratic(7) options compute the maximum rate of change within the analysis region. The Forward Diff option computes the rate of change from the difference between successive sample points. The Quadratic(5) and Quadratic(7) options compute the smoothed rate of change estimated of 5 and 7 sample point windows respectively. The Linear Slope option computes the rate of change from the slope of a straight line fitted to a section of the rising edge of the signal, defined by the Rise Time setting (default value = 10%-90%).
Set the rate of rise mode to select the algorithm used to calculate the rate of change of the signal. The Forward Diff., Quadratic(5), Quadratic(7) options compute the maximum rate of change within the analysis region. The Forward Diff option computes the rate of change from the difference between successive sample points. The Quadratic(5) and Quadratic(7) options compute the smoothed rate of change estimated of 5 and 7 sample point windows respectively. The Linear Slope option computes the rate of change from the slope of a straight line fitted to a section of the rising edge of the signal, defined by the Rise Time setting (default value = 10%-90%).
9) ![]() If you want to change the % decay for the T.x% decay time, enter a new value into the T.x% Decay Time box.
If you want to change the % decay for the T.x% decay time, enter a new value into the T.x% Decay Time box.
10) To begin the analysis of selected range of records, click the Do Analysis button.
On completion of the analysis, the measurements for each record appear in the Results table.
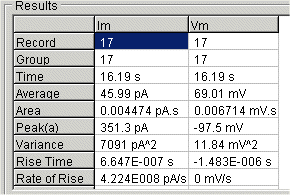
Measurement variables
|
Record |
The sequence number of the record within the data file. |
|
Group |
The number of the group to which the record belongs (used by leak subtraction module). |
|
Time (s) |
The time, relative to the first record in the file, that the record was acquired. |
|
Average |
The average signal level within the analysis region. |
|
Area |
The integral of the signal level within the analysis region. |
|
Peak |
The peak (absolute, positive or negative, depending in peak measurement mode used) signal level within the analysis region. |
|
Variance |
The variance of the signal within the analysis region. |
|
Rise Time |
The time taken for the signal to rise from lo%-hi% (10%-90% default) of peak. (time units) |
|
Rate of Rise |
The maximum rate of change during the rising phase of the signal. |
|
Latency |
The time delay between the zero time cursor and the point at which the signal has risen to 10% of peak. |
|
T.X% |
The time taken for the signal to fall from its peak value to X% (set by user) of peak. |
|
T.90% |
The time taken for the signal to fall from its peak value to 10% of peak. |
|
Baseline |
Signal level, computed from the zero level measurement region, but measured relative to true zero levels of input channel. |
|
% Quantile |
The nth quantile of the signal amplitude data points within the analysis region. |