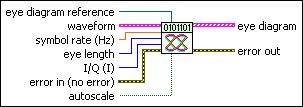
MT Format Eye Diagram VI
Specifies a complex- or real-valued waveform, divides it into segments, and displays those segments as plots on a waveform graph. This VI determines the segment length based on the symbol rate and eye length parameters.
Use the pull-down menu to select an instance of this VI.
MT Format Eye Diagram (complex)

 |
waveform specifies the recovered modulated data for plotting as an eye diagram.
|
||||||||
 |
symbol rate specifies the desired symbol rate, in hertz. The default is 1.0. |
||||||||
 |
eye length specifies the number of symbol periods on the horizontal scale of the eye diagram. The default is 1. |
||||||||
 |
I/Q specifies whether to generate I data or Q data to the eye diagram.
|
||||||||
 |
eye diagram reference is reference to the graph wired to the eye diagram parameter. This connection is prewired when you place the VI from the front panel Controls palette. |
||||||||
 |
autoscale specifies whether to apply autoscaling to the graph referenced in the eye diagram reference control. When this control is set to TRUE, the vertical axis of the eye diagram is scaled to fit the graph, while the horizontal (time) axis is scaled to display exactly (eye length × symbol period) seconds. The default is FALSE (no autoscaling). |
||||||||
 |
error in (no error) can accept error information wired from previously called VIs. Use this information to decide if any functionality should be bypassed in the event of errors from other VIs. Right-click the front panel error in control and select Explain Error or Explain Warning from the shortcut menu for more information about the error.
|
||||||||
 |
eye diagram returns an array of waveform segments for eye diagram display. Each segment has a time length of (eye length × symbol period) seconds. Wire this parameter directly to a waveform graph.
|
||||||||
 |
error out passes error or warning information out of a VI to be used by other VIs. Right-click the front panel error out indicator and select Explain Error or Explain Warning from the shortcut menu for more information about the error.
|
MT Format Eye Diagram (WDT)

 |
waveform specifies the modulated data for plotting as an eye diagram. |
||||||||
 |
symbol rate specifies the desired symbol rate, in hertz. The default is 1.0. |
||||||||
 |
eye length specifies the number of symbol periods on the horizontal scale of the eye diagram. The default is 1. |
||||||||
 |
eye diagram reference specifies a reference to the graph wired to the eye diagram parameter. This parameter aids graph autoscaling. This connection is prewired when you place the VI from the front panel Controls palette. |
||||||||
 |
autoscale specifies whether to apply autoscaling to the graph referenced in the eye diagram reference control. When this control is set to TRUE, the vertical axis of the eye diagram is scaled to fit the graph, while the horizontal (time) axis is scaled to display exactly (eye length × symbol period) seconds. The default is FALSE (no autoscaling). |
||||||||
 |
error in (no error) can accept error information wired from previously called VIs. Use this information to decide if any functionality should be bypassed in the event of errors from other VIs. Right-click the front panel error in control and select Explain Error or Explain Warning from the shortcut menu for more information about the error.
|
||||||||
 |
eye diagram returns an array of waveform segments for eye diagram display. Each segment has a time length of (eye length × symbol period) seconds. Wire this parameter directly to a waveform graph.
|
||||||||
 |
error out passes error or warning information out of a VI to be used by other VIs. Right-click the front panel error out indicator and select Explain Error or Explain Warning from the shortcut menu for more information about the error.
|
Details
 |
Tip For a "clean" eye diagram with distinct, non-shifting transitions, the input waveform should have an integer-valued symbol-rate-to-sample-rate ratio. |
The complex instance of this VI displays either the I or Q component of the input signal, depending on the selection you make on the I/Q parameter. The I and Q components can also be examined simultaneously over time on a 3D graph using the MT Display 3DEye VI.
This VI works in conjunction with a standard LabVIEW graph indicator and is available both from the front panel Controls palette (Controls»Modulation»Digital) and from the block diagram Functions palette (Functions»Modulation»Digital»Utilities).
When selected from the Controls palette to the front panel, this VI is automatically prewired to the appropriate graph. When this VI is placed from the Functions palette onto the block diagram, no connections are automatically wired and you must manually connect the graph indicator on the block diagram.


