MT Apply Fading Profile VI
Applies a fading profile to fade the complex baseband modulated waveform. The faded waveform can be used to test receiver immunity to fading channels.
Use the pull-down menu to select an instance of this VI.
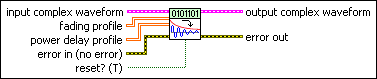
MT Apply Selective Fading Profile
Applies a multipath fading profile to the input complex waveform.
 |
input complex waveform specifies the modulated complex baseband waveform data.
|
||||||
 |
fading profile specifies a two-dimensional array of sample-by-sample profiles to be applied to the input complex waveform for each path in the multipath channel. At each call, the VI begins applying this fading profile from the index point where it left off on the previous iteration unless reset? is set to TRUE. Wire the fading profile parameter of the MT Generate Fading Profile VI to this parameter. |
||||||
 |
power delay profile specifies the arrival time, in seconds, of the different ray paths versus their received power, in dB. The times are relative to the arrival of the first ray path. The first column of the power delay profile array should be the relative power loss (in dB), and the second column represents the relative time of arrival (in seconds). |
||||||
 |
reset? specifies whether the VI begins applying the fading profile at the index point where it left off on the last iteration. Set reset? to TRUE if you want to begin applying the fading profile at index point 0. The default is TRUE. |
||||||
|
error in (no error) can accept error information wired from previously called VIs. Use this information to decide if any functionality should be bypassed in the event of errors from other VIs. Right-click the front panel error in control and select Explain Error or Explain Warning from the shortcut menu for more information about the error.
|
||||||
 |
output complex waveform returns the faded modulated complex baseband waveform data. This parameter is always the same size as the input complex waveform, regardless of the size of the fading profile.
|
||||||
|
error out passes error or warning information out of a VI to be used by other VIs. Right-click the front panel error out indicator and select Explain Error or Explain Warning from the shortcut menu for more information about the error.
|


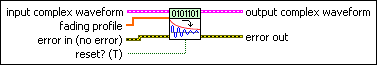
MT Apply Flat Fading Profile
Applies a flat fading profile to the input complex waveform.
 |
Note This instance normalizes the fading profile parameter to ensure that the power in the input complex waveform is equal to the fading variance. The Modulation Toolkit 4.0 version of MT Apply Flat Fading does not apply this normalization algorithm. |
|
input complex waveform specifies the modulated complex baseband waveform data.
|
||||||
|
fading profile specifies the sample-by-sample profile to be applied to the input complex waveform. At each call, the VI begins applying this fading profile from the index point where it left off on the previous iteration unless reset? is set to TRUE. Wire the fading profile parameter of the MT Generate Fading Profile VI to this parameter. |
||||||
|
reset? specifies whether the VI begins applying the fading profile at the index point where it left off on the last iteration. Set reset? to TRUE if you want to begin applying the fading profile at index point 0. The default is TRUE. |
||||||
|
error in (no error) can accept error information wired from previously called VIs. Use this information to decide if any functionality should be bypassed in the event of errors from other VIs. Right-click the front panel error in control and select Explain Error or Explain Warning from the shortcut menu for more information about the error.
|
||||||
|
output complex waveform returns the faded modulated complex baseband waveform data. This parameter is always the same size as the input complex waveform, regardless of the size of the fading profile.
|
||||||
|
error out passes error or warning information out of a VI to be used by other VIs. Right-click the front panel error out indicator and select Explain Error or Explain Warning from the shortcut menu for more information about the error.
|
Details
If the fading profile is shorter than the input complex waveform, the VI repeats the fading profile until the entire input complex waveform is covered. If the fading profile is longer than the input complex waveform, the VI begins applying the fading profile at the index point where it left off during the previous iteration (when reset? is set to FALSE). However, to maintain the phase continuity of the input complex waveform, the profile length should be equal to the input waveform length.
Normalizing the Rician Fading Profile
To match the output complex waveform power to the specified fading variance, this VI first normalizes the power array of the power delay profile, and the amplitude corresponding to power element is then multiplied by the corresponding fading profile, fkl, where l = 1,2 …, L, and L is the profile length.
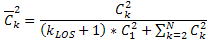
For the selective Rayleigh profile, the power coefficients,C2k, corresponding to each path are shown in the following equation:

The normalized power coefficients can then be represented by

for k = 1,...,N.
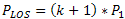
For the selective Rician profile, the power in the line-of-sight (LOS) path is given by
The normalized power coefficients can then be represented by the following equation:
By multiplying these power coefficients with the generated fading profile, fkl, for each path, we can obtain the amplitude, akl, to apply to the Rician profile as shown in the following equation:

for k = 1,...,N and l = 1,...,L, where L is the profile length.
The time array,  , is approximated to an integer multiple of the sampling duration, dt, to obtain the integer delay,
nk. The integer delay is applied to the input complex waveform as shown by the following equation:
, is approximated to an integer multiple of the sampling duration, dt, to obtain the integer delay,
nk. The integer delay is applied to the input complex waveform as shown by the following equation:

The input complex waveform is then delayed for each path by yk[n] = x[n - nk], where n = 1,...,M and M is the input complex waveform size.
Finally, yk[n] is point-by-point multiplied with amplitude coefficients to obtain the output complex waveform as shown by the following equation:
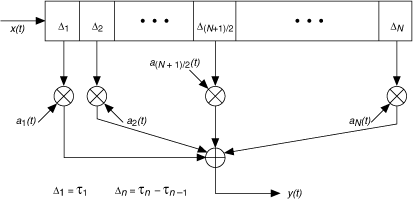
In the MT Apply Selective Fading Profile VI, the power from the power delay profile, specified for each path, is applied to the corresponding fading profile generated by the MT Generate Fading Profile VI. The power delay profile is specified in terms of power,Pk, and time, , for each path, where k = 1,2…,N. The delay in the power delay profile is approximated to an integer multiple of the sampling duration, /dt for each path, for k = 1,…N, where N is the total number of paths. The input complex waveform is delayed by this amount and then multiplied by the corresponding attenuated fading profile. All these paths are summed to calculate the received signal, y(t), as illustrated by the following figure.
References
Rappaport, Theodore S. Wireless Communications: Principles and Practice (2nd Edition). Prentice Hall PTR, December 2001.
Trantner, William H., and Theodore S. Rappaport.Principles of Communication Systems Simulation with Wireless Applications. Prentice Hall PTR, January 2004.
Dent, P. et al. “Jakes Fading Model Revisited,” Electronics Letters: June 1993.