MT Apply IQ Impairments VI

LabView Digital Modulation

MT Apply IQ Impairments VI

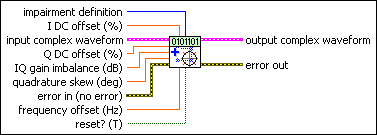
Applies various I/Q impairments to the complex baseband modulated waveform.
Details

MT Apply IQ Impairments

ccclst.gif

input complex waveform specifies the modulated complex baseband waveform data.

cdbl.gif

t0 specifies the trigger (start) time of the Y array. The default is 0.0.

cdbl.gif

dt specifies the time interval between data points in the Y array. The default is 1.0.

c1dcdb.gif

Y specifies the complex-valued signal-only baseband modulated waveform. The real and imaginary parts of this complex data array correspond to the in-phase (I) and quadrature-phase (Q) data, respectively.

cdbl.gif

Q DC offset specifies the desired DC offset of the Q waveform as a percentage of full scale of the input complex waveform. Valid values are between –100 and +100. The default is 0.0.

cdbl.gif

IQ gain imbalance specifies the desired ratio of I gain to Q gain, in dB. Valid values are between –6.0 and +6.0. The default is 0.0.

cdbl.gif

quadrature skew specifies the desired quadrature skew of the complex waveform in degrees. Valid values are between –30.0 and +30.0 degrees. The default is 0.0.

cdbl.gif

I DC offset specifies the desired DC offset of the I waveform as a percentage of full scale of the input complex waveform. Valid values are between –100 and +100. The default is 0.0.

cenum.gif

impairment definition specifies which set of equations is used to represent impairments.

In the equations in the following table, I is the real component and Q is the imaginary component of each sample in the input complex waveform. I' and Q' are the real and imaginary components of the corresponding sample in the output complex waveform, I ° is I DC Offset (%) / 100, and Q ° is Q DC Offset (%) / 100.

Vertical Shear (0)

The definition uses the following equations for I/Q impairments:

I' = a * I + I °

Q' = a * sin(φ) * I + b * cos(φ) * Q + Q °

where

φ = the specified quadrature skew, in radians

= 10(IQ gain imbalance/20)

a = * b

b =

In matrix form, these equations are represented by

where

Axis Shear (1)

With this option selected, this VI uses an impairment definition that simplifies the conversion between measured impairments and their inverse impairments. For example, you may want to measure the I/Q impairments of a system and compensate for those impairments by applying the inverse impairments to the generated or received waveform. Using the Axis Shear definition, given a measured skew and imbalance (in dB), the inverse impairments are –1.0 * skew and –1.0 * imbalance. This definition uses the following equations for IQ impairments:

where

= 10(IQ gain imbalance/20)

φ = the specified quadrature skew, in radians

In matrix form, these equations are represented by

where

cdbl.gif

frequency offset specifies the desired frequency offset to apply to the output complex waveform, in hertz. The default is 0.0.

cbool.gif

reset? specifies whether the VI continues applying the impairments using the previous iteration states. reset? must be set to TRUE when you want to restart the impairment generation process. The default is TRUE.

ccclst.gif

error in (no error) can accept error information wired from previously called VIs. Use this information to decide if any functionality should be bypassed in the event of errors from other VIs. Right-click the front panel error in control and select Explain Error or Explain Warning from the shortcut menu for more information about the error.

cbool.gif

status is TRUE (X) if an error occurred or FALSE (checkmark) to indicate a warning or that no error occurred. Right-click the front panel error in control and select Explain Error or Explain Warning from the shortcut menu for more information about the error.

ci32.gif

code identifies the error or warning code. Right-click the front panel error in control and select Explain Error or Explain Warning from the shortcut menu for more information about the error.

cstr.gif

source describes the origin of the error or warning. Right-click the front panel error in control and select Explain Error or Explain Warning from the shortcut menu for more information about the error.

icclst.gif

output complex waveform returns the impaired complex baseband modulated waveform data.

idbl.gif

t0 returns the trigger (start) time of the Y array.

idbl.gif

dt returns the time between values in the Y array.

i1dcdb.gif

Y returns the complex-valued signal-only baseband modulated waveform. The real and imaginary parts of this complex data array correspond to the in-phase (I) and quadrature-phase (Q) data, respectively.

icclst.gif

error out passes error or warning information out of a VI to be used by other VIs. Right-click the front panel error out indicator and select Explain Error or Explain Warning from the shortcut menu for more information about the error.

ibool.gif

status is TRUE (X) if an error occurred or FALSE (checkmark) to indicate a warning or that no error occurred. Right-click the front panel error out indicator and select Explain Error or Explain Warning from the shortcut menu for more information about the error.

ii32.gif

code is the error or warning code. Right-click the front panel error out indicator and select Explain Error or Explain Warning from the shortcut menu for more information about the error.

istr.gif

source describes the origin of the error or warning. Right-click the front panel error out indicator and select Explain Error or Explain Warning from the shortcut menu for more information about the error.

Details

For more information about the Vertical Shear definition, refer to Kafadar, Karen. “Statistical Calibration of a Vector Demodulator,” HP Journal: June 1988.