| XY oscilloscope |


|
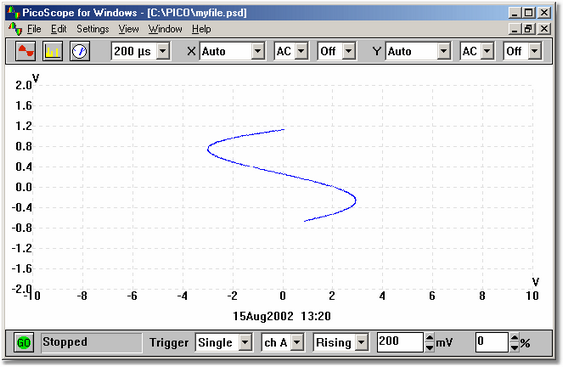
When the active window is an XY oscilloscope, the XY oscilloscope toolbar is displayed at the top of the screen.
Timebase
The XY Timebase controls the time interval for each scan. Ideally, it should be a little longer than a single cycle of the signal that you wish to observe. You can zoom in using the toolbar or the mouse.
Voltage range
If you use PicoScope with oscilloscopes from the ADC-100, ADC-200, PicoScope 2000 or 3000 series, you can adjust the input voltage range. The Auto option is useful if you are switching between different, but consistent, signals. You can also add custom ranges so that the values are displayed in other units, such as pressure or acceleration units.
If the input voltage exceeds the chosen range, an overvoltage warning symbol
Accumulate
If the waveform you are displaying is periodic with only minor fluctuations, you can select Accumulate successive cycles. This is a tickbox on the Options menu in Settings. The computer then draws new traces on top of the old ones, so that any unusual traces - for instance, glitches and missing pulses - stand out.
Grid
By default, PicoScope displays a 10x10 grid. You can turn this grid off if it obscures important information.
Rulers
You can add either horizontal or vertical rulers to the graph using the mouse buttons. PicoScope reports the exact position of each ruler, and the difference between two rulers on the same axis.
 Related Topics