| Spectrum analyser |


|
This section describes the measurements available on spectrum analyser windows and the concepts involved in spectrum measurements.
Most measurements are based on a data source. The source for measurements on the spectrum analyser window can be defined as any one of the following:
At peak
Position of the highest amplitude signal
At X
Position of the X cursor
At O
Position of the O cursor
O to X
Position of both cursors (intermodulation distortion only)
For each measurement, the data source can be specified.
Ratio measurements can be displayed as percent or dB: this can be specified for each measurement.
The default values for the data source and percent/dB can be specified in the Measurement options dialog box.
For harmonic analysis, the harmonics are integer multiples of the data source. The band number of the nth harmonic may be adjusted by ±n/2 bands to take account of rounding of the data source to the nearest band. The number of harmonics to include can be specified in the Measurement options dialog box. If the specified number of harmonics is not available within the selected frequency range, any measurements that require the harmonics will be left blank.
Ideally if an FFT were performed on a perfectly pure sine wave, the frequency display would show only an infinitely thin spike at the fundamental frequency of that sine wave. In reality the frequency information tends to get spread out by the finite number of FFT points and end effects which leads to a broadening of the spike. The measurement calculations will use expected values for the spread. These will be a function of the number of points and the window type.
Another effect of the FFT process is to lump all the components which are varying more slowly than the entire sampling period into a band labelled as DC. This can lead to a false impression of the actual DC value. The measurement calculations deal with this by ignoring the first spread bands.
Frequency
This displays the peak frequency of the data source.
Amplitude
This displays the peak amplitude of the data source.
Total power
This displays the total power of the entire spectrum.
Calculated by taking the root of the sum of each RMS-value-squared.
| Total power = sqrt(sum(value²))
|
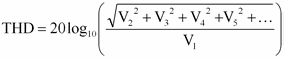
THD
Total Harmonic Distortion. This is the ratio of the harmonic power to the power at the datum. In the following equation, V1 is the RMS value at the datum frequency and V2..V5 are RMS values at the harmonics:
|
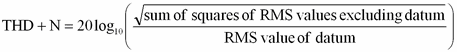
THD + Noise
Total Harmonic Distortion + Noise. This is the ratio of the harmonic power plus noise to the fundamental power. THD+N values will almost always be greater than the THD values for the same signal. THD + Noise can be expressed as:
|
SFDR
Spurious Free Dynamic Range. This is the ratio of the amplitude of the datum point (normally the Peak Frequency component) and the frequency component with the second largest amplitude (call it "SFDR frequency"). The component at the "SFDR frequency", is not necessarily a harmonic of the fundamental frequency component. For example it might be a strong, independent noise signal.
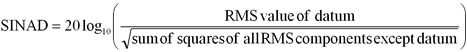
SINAD
Signal to Noise and Distortion Ratio. This is the ratio, in decibels, of the signal-plus-noise-plus-distortion to noise-plus-distortion.
|
Note: Hanning or Blackman windows are recommended because of their low noise.
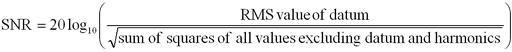
SNR
Signal to Noise Ratio. This is the ratio, in decibels, of the mean signal power to the mean noise power.
|
Note:- Hanning or Blackman windows are recommended because of their low noise.
IMD
Intermodulation Distortion. This is a measure of the distortion caused by the nonlinear mixing of two tones.
When multiple signals are injected into a device, modulation or nonlinear mixing of these two signals can occur. For input signals at frequencies f1 and f2, the two second-order distortion signals will be found at frequencies:
| f3 = (f1 + f2)
|
| f4 = (f1 - f2).
|
|
|
In the second-order case, the intermodulation distortion is given by:
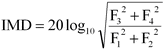
|
| F3 and F4 are the amplitudes of the two second-order distortion terms (at frequencies f3 and f4 defined above)
|
| F1 and F2 are the amplitudes of the input tones (at frequencies f1 and f2, as marked by the frequency rulers in the spectrum window).
|
For reference, the third-order terms are at frequencies (2F1 + F2), (2F1 - F2), (F1 + 2F2) and (F1 - 2F2).
Note: Hanning or Blackman windows are recommended because of their low noise. An FFT size of 4096 or greater is recommended in order to provide adequate spectral resolution for the IMD measurements.
Second, Third, Fourth, Fifth, Sixth
The amplitude at the second, third, fourth, fifth or sixth harmonic.
Gain
The ratio of the power in channel A to the power in channel B at the reference point. This is used to check the gain of an amplifier.
Scan time
The time it took to record the data currently displayed.
 Related Topics