| Screen layout |


|
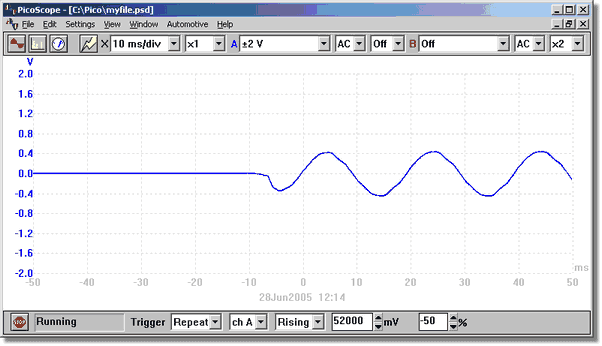
The PicoScope application window is divided into the following three areas:
 Display area
| Used to display the instrument windows containing the data read from the oscilloscope.
|
|
|
Instrument toolbar
| Located at the top of the screen, this provides the most commonly used controls for the active instrument window. Each instrument window has its own toolbar and controls.
|
|
|
Sample toolbar
| Positioned along the bottom of the window, this toolbar shows the current sampling status and provides controls for triggering.
|