| Adding a custom range |


|
Custom Ranges are used to display a trace in units of your choice. For example, to display the output of a pressure sensor in pascal.
Non-linear sensors, can also be mapped to new units of measure. PicoScope reads in a table of values supplied by the user and interpolates data automatically.
|
|
|
|
2 Fill in the scaling look up table and other details in the Edit custom range dialog box
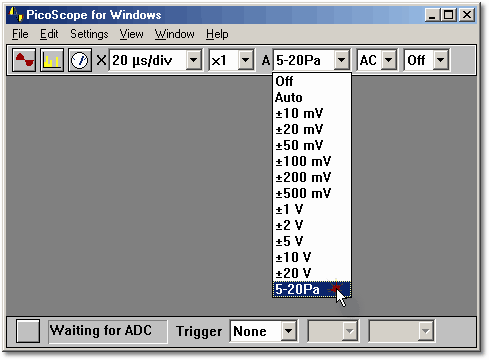
3 Select the custom range from the control bar shown below
 Related Topics