| Scope Options |


|
From the Settings menu, select Options....
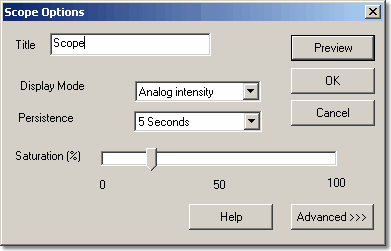
This dialog box is used to set a number of optional features for the active oscilloscope window. If the oscilloscope is running whilst this dialog box is active, you can use the Preview button to apply the effects directly to the trace. You can either save these changes by clicking on Ok, or you can revert to the original settings by clicking on Cancel.
Note: These functions are not available on the Oscilloscope toolbar.
Title
This is used to set the title for the active window. It appears on the title bar of the window and on printed reports.
Display Mode
You can display data in several formats, some based on single cycles of data and others on multiple cycles.
The following two single cycle display modes are available:
 Current (Unfiltered)
| This is the default display mode. All the points of the current cycle are displayed, without any filtering being done
|
Current, (Filtered)
| This involves use of a simple filter to help remove high frequency noise from the active trace
|
In multi-cycle display modes, previous cycles affect how the active cycle is displayed. For example, a particular section of a trace may be displayed in a different colour depending on how often cycles pass over each other. You can reset the results so far by clicking on the Stop button, then the Start button. Below is a list of all the multi-cycle modes:
Average
| The average of all cycles since you started. This is useful for removing random noise from the active trace
|
Min, max & average
| A shaded area showing the minimum and maximum of all cycles since you started with a trace showing the average. As with average, this removes random noise from repetitive signals. In addition, this also gives an indication of the level of noise of a signal.
|
Min, max & current
| A shaded area showing the minimum and maximum of all cycles since you started with a trace showing the current data. This mode is ideal for measuring the time jitter of signals such as clock waveforms.
|
Digital colour
| This mode, a type of persistence mode, is ideal for spotting intermittent glitches in digital signals. The area of the trace that has the highest population density is red, whereas the area with the lowest population density is blue. Digital colour mode does not decay over time.
|
Analog intensity
| This mode emulates the phosphor display of a conventional analog oscilloscope and is useful for displaying complex analog signals such as video waveforms and analog modulation signals. The area of the trace that has the highest population density is the strongest colour. The area with the lowest population density and/or a high slew rate (low rise time/fall time) is the lightest colour.
|
Persistence
This option is available in both analog intensity and digital colour modes. The word 'persistence' in this context refers to the length of time a trace remains on the screen. The following options are available in the drop-down list:
No Persistence
| Only the current trace is displayed. This may be useful in analog intensity mode if you have a very large number of samples
|
500 ms
1 second
5 seconds
15 seconds
30 seconds
60 seconds
Infinite persistence
Saturation (%)
This option is available in both analog intensity and digital colour modes.
The saturation control bar is used to adjust the colour-coding applied to the population. This can reveal more detail contained in areas where the population density is lower.
A 0% saturation level will show only the most densely populated areas as the hottest or boldest colours, while the 50% saturation level shows the upper half of the population range as the hottest or boldest colour.
Advanced >>
The Advanced >> button opens the Scope Advanced Options dialog box.
 Related Topics