| Spectrum analyser |


|
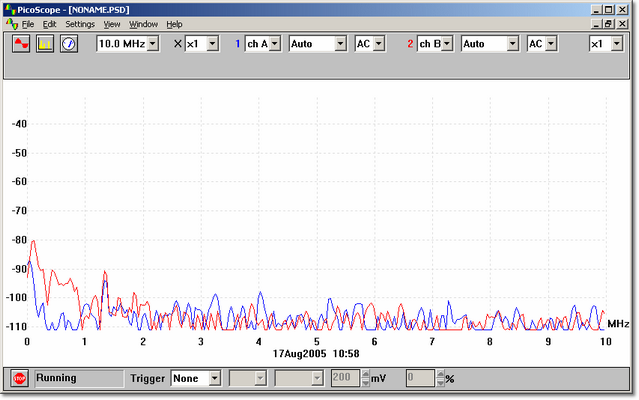
The spectrum analyser window in PicoScope contains the spectrum analyser instrument. When the spectrum analyser window is active, the Spectrum analyser toolbar is displayed at the top of the screen.
The spectrum analyser window uses a FFT to convert a set of samples taken at fixed time intervals into a distribution showing the amount of energy in each of a number of frequency bands up to a maximum frequency. The maximum frequency is half the frequency corresponding to the sampling rate.
Like all digital signal analysis tools, PicoScope may give misleading results due to aliasing. Where possible, PicoScope uses oversampling to reduce aliasing effects.
Maximum frequency
PicoScope collects data to display a spectrum up to a certain maximum frequency. You can then display the spectrum for any range of frequencies up to this limit. The higher the frequency, however, the wider the interval between spectrum frequencies. Set the maximum frequency using the Spectrum Timebase dialog box or the Spectrum analyser toolbar.
Note: PicoScope needs to collect a large, contiguous block of data for spectrum analysis. If you specify a very low maximum frequency, this will take a long time to collect for some products: PicoScope prevents normal Windows® operation during this data collection.
Y axis scaling
On the spectrum display, the Y axis represents the power at a specified frequency. The power can be expressed either as volts (RMS), or as dB. Set the Y axis scaling using the Spectrum Options dialog box.
X axis scaling
The X axis represents frequency. You can display the frequency either in linear or in logarithmic form. Set the X axis scaling using the Spectrum Options dialog box.
Voltage range
The spectrum display may give confusing results if the signal exceeds the input voltage range: under most circumstances, we strongly advise using the Auto voltage range. If the signal is variable or intermittent, it may be advisable to use an oscilloscope window to determine the maximum required voltage range, and then fix the spectrum voltage range at that level.
Display type
In addition to displaying the current spectrum, you can also display the average or the peak value of successive cycles.
Windowing
PicoScope performs an analysis on a relatively short block of samples. The 'cutting' of this block from the data stream can introduce distortion which produces side-lobes on spectrum peaks. This effect can be reduced by multiplying the block of data by a set of factors which 'rounds off' the ends of the data. This technique is known as windowing.
PicoScope supports several different windowing methods: no windowing algorithm is guaranteed to eliminate all end effects, but switching between two methods can give a clue whether a particular peak is a side-lobe or a genuine peak. For general use, we recommend the Blackman window. Select a window type using the Spectrum Options dialog box.
Grid
PicoScope displays a 10x10 grid. You can turn this grid off if it obscures important information.
Ruler
You can use the mouse buttons to add a ruler to the spectrum analyser window. The computer displays the frequency at the current ruler position, and the amplitude of each trace at that frequency.
 Related Topics