| Oscilloscope |


|
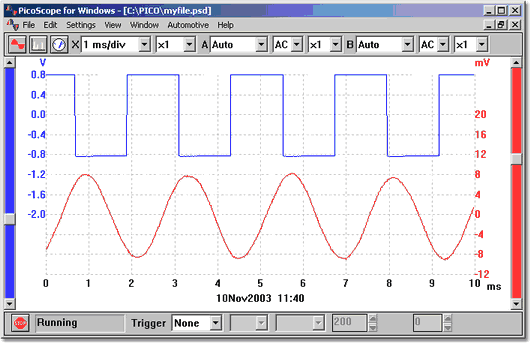
The oscilloscope window in PicoScope contains the PC oscilloscope. When the oscilloscope window is active, the Oscilloscope toolbar is displayed at the top of the screen.
Timebase
The Scope Timebase dialog box controls the time interval across the oscilloscope display. Like a conventional oscilloscope, it is normally specified as a time per division. There are ten divisions across the screen, so the total time interval is ten times the timebase. If you are not accustomed to using a conventional oscilloscope, you may find it easier to specify the timebase as a time per scan (see the Scope Advanced Options dialog box.) You can zoom in using the toolbar or the mouse.
Channels
For multi-channel oscilloscopes, you can select which channels to display on the oscilloscope. With two channels, each channel has a separate axis and each trace and its axis are displayed in a different colour.
Voltage range
If you use PicoScope with oscilloscopes from the ADC-100, ADC-200 or PicoScope 2000 and 3000 series, it is possible to adjust the input voltage range. The Auto option is useful if you are switching between different, but consistent, signals.
If the input voltage exceeds the chosen range, an overvoltage warning symbol
You can also add custom ranges so that the values are displayed in some other oscilloscopes, for example pressure or acceleration.
AC/DC
If you use PicoScope with oscilloscopes from the ADC-200 and PicoScope 2000 and 3000 series, the AC/DC switches are software-selectable.
Grid
PicoScope displays a 10x10 grid. You can turn this grid off if it obscures important information: select Settings | Options | Advanced and untick the Display a grid tick box.
Rulers
You can add either horizontal or vertical rulers to the graph using the mouse buttons. PicoScope reports the exact position of each ruler, and the difference between two rulers on the same axis.
Display types
The oscilloscope window can show you various combinations of the current data, the minimum, maximum and average of successive cycles. It can accumulate successive cycles on the screen. Note that it is not possible to print out an accumulated trace.
Measurements
PicoScope can take over 20 different measurements, using either the whole trace, the section between the cursors or the cycle around one cursor. You can select any combination of measurements, and specify alarm limits (error limits) for each measure. The current value and various statistical measures (mean, standard deviation, etc) are displayed underneath the trace.
Slow sampling
When the time per scan is more than a second, the computer can work in three ways:
 Standard mode
| It collects and displays the data for a complete scan, then starts again collecting and displaying the data for another complete scan
|
Chart recorder mode
| It collects data continuously and displays the most data for the most recent scan interval. Note: Chart recorder mode is not compatible with trigger modes other than None
|
Block mode
| It collects a block of data (no display update during collection) and then displays the whole block at once. There is no limit to the maximum number of samples, and there will not be gaps while the display is updated
|
Note: In standard and chart recorder modes, the sampling is controlled by the computer and the maximum it can collect is one sample per millisecond. In addition, there may be gaps in the sampling while the display is updated. See also: Configuring your oscilloscope.
ETS
Some products support ETS (Equivalent Time Sampling.) This offers a higher effective sampling rate when used with repetitive signals. Note that ETS should not be used for one-shot or non-repetitive signals.
When accessed using the ETS option in the sampling and trigger toolbar, some new, faster timebases are added to the instrument toolbar.
 Related Topics