


A surface is a raster file that contains elevation information. Use theming to make the surface reflect its elevation.
- Switch the Task Pane to the Display Manager.
- In
the Display Manager, click Data
 Connect
To Data.
Connect
To Data. - In
the Data Connect dialog box, under Data Connections By
Provider, click Add Raster Image Or Surface
Connection and click
 next to Source
File Or Folder.
next to Source
File Or Folder. - In
the Open dialog box, browse to
the ENTERPRISE.dem file,
select it, and click Open.
This file should be in the location where you copied the sample data.
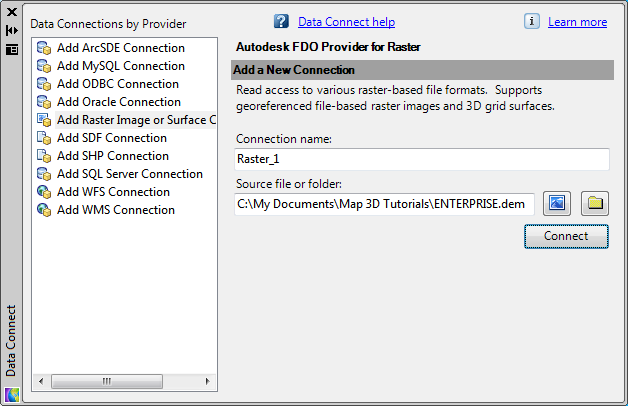
Connect to the surface file in the Data Connect dialog box.
- In
the Data Connect dialog box, click Connect.NoteThe coordinate system for the DEM file is UTM27-10. AutoCAD Map 3D automatically converts the data from that coordinate system to the one specified for your map.
- Select the box for the DEM under Add Data To Map and click Add To Map.
- Close the Data Connect dialog box to see the surface in your map.
- In Display Manager, select the ENTERPRISE layer, which contains the surface.
- Click
 .
. - Create
a palette for the theme.
- In
the Style Editor, under Raster Style For 0 -
Infinity Scale Range, click the down arrow in the Style entry
and select Theme (even if it is already
selected).
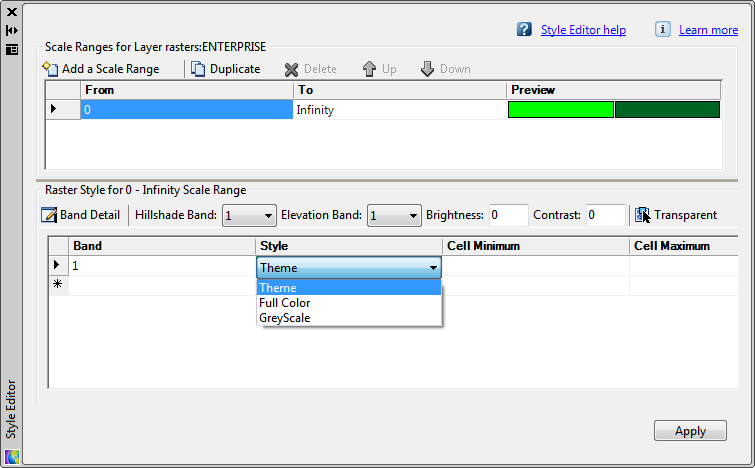
Click the first Style entry and select Theme.
- In
the Theme dialog box, under Specify
A Theme, click Palette and
select USGS National Map Palette.
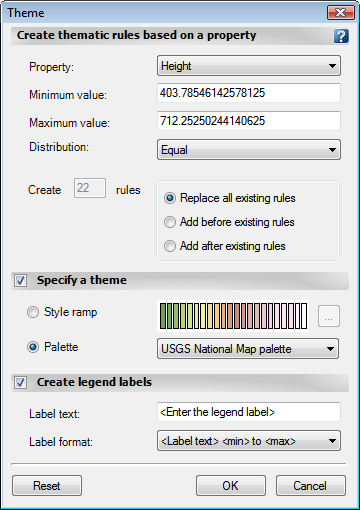
Select the USGS National Map palette as the theme for the surface.
- Click OK and then click Apply. Close the Style Editor.
- In
the Style Editor, under Raster Style For 0 -
Infinity Scale Range, click the down arrow in the Style entry
and select Theme (even if it is already
selected).
- Add exaggeration to show the differences in elevation more dramatically.
- Add
contour lines to create a topographic map.
Each contour line connects points of equal elevation on the surface. The lines identify the elevation at a specific location on the surface, which can help the viewer clarify and analyze the 3D surface terrain.
- In
Display Manager, right-click the surface layer and click Create
Contour Layer.
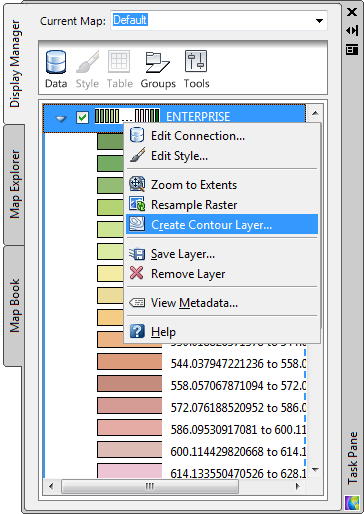
In Display Manager, right-click the surface layer to create contours.
- In the Generate Contour dialog box, in the Contour Elevation Interval list, select 20.
- Leave the Units set to Meters.
- In the Major Contour Every list, select 4. This makes every fourth contour line bold.
- Select Label The Elevation. This labels the major (bold) contour lines only.
- For Create
Contour As, select polyline.
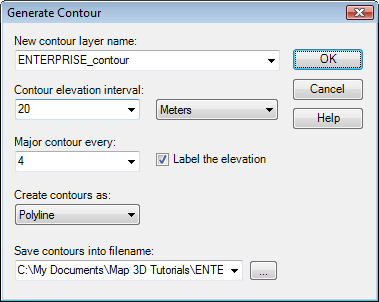
The Generate Contour dialog box should look like this.
- Click OK.
- In
Display Manager, right-click the surface layer and click Create
Contour Layer.

To continue this tutorial, go to Exercise 3: Add a layer on top of the surface.