PenUpPenDown
PenUpPenDown — Allows you to stop or begin drawing data on a plot
Script Syntax
PenUpOutputNamesOutputNamesOutputNamesis the list of subscribers thatPenUpcommand operates on. WhenPenUpcommand is used on multiple subscribers, then the subscribers need to be separated by a space.PenDownOutputNamesOutputNamesOutputNamesis the list of subscribers thatPenDowncommand operates on. WhenPenDowncommand is used on multiple subscribers, then the subscribers need to be separated by a space.
Description
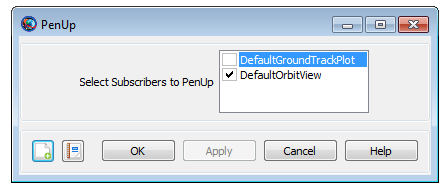
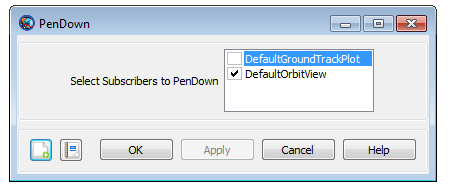
The PenUp and PenDown commands allow you to stop or begin drawing data on a plot. The PenUp and PenDown commands operate on XYPlot, OrbitView and GroundTrackPlot subscribers. GMAT allows you to insert PenUp and PenDown commands into the Mission tree at any location. This allows you to stop or begin drawing data output on a plot at any point in your mission. The PenUp and PenDown commands can be used through GMAT’s GUI or the script interface.
Options
| Option | Description | ||||||||||
|---|---|---|---|---|---|---|---|---|---|---|---|
| OutputNames | When a PenUp command is issued for a plot, no data is drawn to that plot until a PenDown command is issued for that plot
|
||||||||||
| OutputNames | When a PenDown command is issued for a plot, data is drawn for each integration step until a PenUp command is issued for that plot.
|
Remarks
XYPlot, OrbitView and GroundTrackPlot subscribers plot data at each integration step of the entire mission duration. If you want to plot data at specific points in your mission, then a PenUp and PenDown command can be inserted into the mission sequence to control when a subscriber plots data. For example, when a PenUp command is issued for XYPlot, OrbitView or GroundTrackPlot, no data is drawn to that plot until a PenDown command is issued for that same plot. Similarly, when a PenDown command is issued for any of the three subscribers, then data is drawn for each integration step until a PenUp command is issued for that specific subscriber. Refer to the Examples section below to see how PenUp and PenDown commands can be used in the Mission tree.
Examples
This example shows how to use PenUp and PenDown commands on multiple subscribers. PenUp and PenDown commands are used on XYPlot, OrbitView and GroundTrackPlot. Data is drawn to the plots for first day of the propagation, turned off for second day of propagation and then data is drawn for third day of the propagation:
          Create Spacecraft aSat
Create Propagator aProp

Create XYPlot aPlot
aPlot.XVariable = aSat.ElapsedDays
aPlot.YVariables = {aSat.Earth.SMA}

Create OrbitView anOrbitViewPlot
anOrbitViewPlot.Add = {aSat, Earth}

Create GroundTrackPlot aGroundTrackPlot
aGroundTrackPlot.Add = {aSat, Earth}

BeginMissionSequence

Propagate aProp(aSat) {aSat.ElapsedDays = 1}
PenUp aGroundTrackPlot anOrbitViewPlot aPlot
Propagate aProp(aSat) {aSat.ElapsedDays = 1}
PenDown aGroundTrackPlot anOrbitViewPlot aPlot
Propagate aProp(aSat) {aSat.ElapsedDays = 1}
This example shows how to use PenUp and PenDown commands on a single XYPlot subscriber. Data is drawn to the plot for one-third of the day, turned off for second one-third of the day and then data is drawn again for last one-third of the day:
          Create Spacecraft aSat
Create Propagator aProp

Create XYPlot aPlot1
aPlot1.XVariable = aSat.ElapsedDays
aPlot1.YVariables = {aSat.Earth.Altitude}

Create Variable I
I = 0

BeginMissionSequence

While aSat.ElapsedDays < 1.0

 Propagate aProp(aSat) {aSat.ElapsedSecs = 60}
 If I == 480
 PenUp aPlot1
 EndIf

 If I == 960
 PenDown aPlot1
 EndIf

 GMAT I = I +1

EndWhile