GroundTrackPlot
From General Mission Analysis Tool
GroundTrackPlot
GroundTrackPlot — A user-defined resource that draws longitude and latitude time-history of a spacecraft
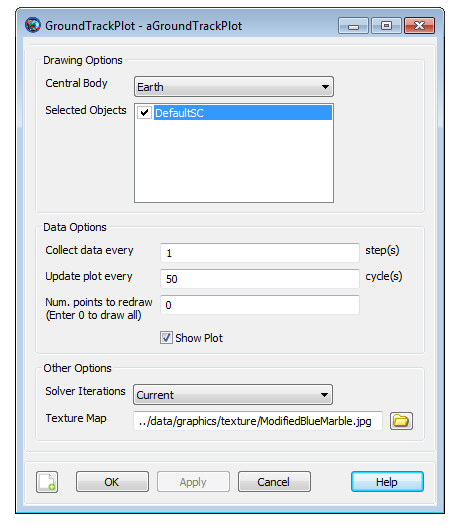
Description
The GroundTrackPlot resource allows you to draw spacecraft’s longitude and latitude time-history onto the texture map of a user-selected central body. GMAT allows you to draw ground track plots of any number of spacecrafts onto a single texture map. You can also create multiple GroundTrackPlot resources by using either the GUI or script interface of GMAT. GMAT also provides the option of when to plot and stop plotting ground track of a spacecraft to a GroundTrackPlot through the Toggle On/Off command. See the Remarks section below for detailed discussion of the interaction between GroundTrackPlot resource and the Toggle command. GroundTrackPlot resource also allows you to display any number of user-defined ground stations onto the texture map of the central body.
See Also: Toggle, GroundStation, Color
Fields
| Field | Description | ||||||||||||
|---|---|---|---|---|---|---|---|---|---|---|---|---|---|
| Add | Allows the user to pick selected resources such as
Spacecrafts or
GroundStations. The
GroundTrackPlot object is used to draw
spacecraft's longtitude and latitude time-history on a
two-dimensional texture map of a central body that you select.
After creating GroundStation object, you can
also add ground stations onto the the texture map of the central
body. To select multiple Spacecrafts or
GroundStations, seperate the list by comma
and enclose the list in curly brackets. For Example:
|
||||||||||||
| CentralBody | The central body of the Ground track plot. This field cannot be modified in the Mission Sequence.
|
||||||||||||
| DataCollectFrequency | The number of integration steps to skip between plot points. This field cannot be modified in the Mission Sequence.
|
||||||||||||
| Maximized | Allows the user to maximize the GroundTrackPlot window. This field cannot be modified in the Mission Sequence.
|
||||||||||||
| NumPointsToRedraw | The number of plot points to retain and redraw during propagation and animation. 0 indicates to redraw all. This field cannot be modified in the Mission Sequence.
|
||||||||||||
| RelativeZOrder | Allows the user to select which GroundTrackPlot window to display first on the screen. The GroundTrackPlot with lowest RelativeZOrder value will be displayed last while GroundTrackPlot with highest RelativeZOrder value will be displayed first. This field cannot be modified in the Mission Sequence.
|
||||||||||||
| ShowPlot | This field specifies whether to show ground track plot during a mission run. This field cannot be modified in the Mission Sequence.
|
||||||||||||
| Size | Allows the user to control the display size of GroundTrackPlot window. First value in [0 0] matrix controls horizonal size and second value controls vertical size of GroundTrackPlot display window. This field cannot be modified in the Mission Sequence.
|
||||||||||||
| SolverIterations | This field determines whether or not ground track data associated with perturbed trajectories during a solver (Targeter, Optimize) sequence is displayed in the GroundTrackPlot. When SolverIterations is set to All, all perturbations/iterations are plotted in the GroundTrackPlot. When SolverIterations is set to Current, only the current solution or perturbation is plotted in GroundTrackPlot. When SolverIterations is set to None, only the final nominal run is plotted on the GroundTrackPlot.
|
||||||||||||
| TextureMap | Allows you to enter or select any user-defined texture map image for the central body. This field cannot be modified in the Mission Sequence.
|
||||||||||||
| UpdatePlotFrequency | The number of plot points to collect before updating a ground track plot. This field cannot be modified in the Mission Sequence.
|
||||||||||||
| Upperleft | Allows the user to pan the GroundTrackPlot display window in any direction. First value in [0 0] matrix helps to pan the GroundTrackPlot window horizontally and second value helps to pan the window vertically. This field cannot be modified in the Mission Sequence.
|
Remarks
Behavior when using GroundTrackPlot Resource & Toggle Command
The GroundTrackPlot resource draws the longitude and latitude time-history of a spacecraft at each propagation step of the entire mission duration. If you want to report data to a GroundTrackPlot at specific points in your mission, then a Toggle On/Off command can be inserted into the mission sequence to control when the GroundTrackPlot is to draw data. When Toggle Off command is issued for a GroundTrackPlot, no ground track data is drawn until a Toggle On command is issued. Similarly when a Toggle On command is used, ground track data is drawn at each integration step until a Toggle Off command is used.
Below is an example script snippet that shows how to use Toggle Off and Toggle On command while using the GroundTrackPlot resource. GroundTrackPlot is turned off for the first 2 days of the propagation:
          Create Spacecraft aSat
Create Propagator aProp

Create GroundTrackPlot aGroundTrackPlot
aGroundTrackPlot.Add = {aSat}

BeginMissionSequence

Toggle aGroundTrackPlot Off
Propagate aProp(aSat) {aSat.ElapsedDays = 2}
Toggle aGroundTrackPlot On
Propagate aProp(aSat) {aSat.ElapsedDays = 4}
Behavior when Plotting Data in Iterative Processes
GMAT allows you to specify how data is plotted onto a plot during iterative processes such as differential correction or optimization. The SolverIterations field of GroundTrackPlot resource supports 3 options which are described in the table below:
| SolverIterations options | Description |
|---|---|
| Current |
Shows only current iteration/perturbation in an iterative process and draws current iteration to a plot |
| All |
Shows all iterations/perturbations in an iterative process and draws all iterations/perturbations to a plot |
| None |
Shows only the final solution after the end of an iterative process and draws only final solution to a plot |
Behavior when Plotting Longitude and Latitude time-history of a Spacecraft
GMAT’s GroundTrackPlot resource allows you to draw longitude and latitude time-history of a spacecraft. You can choose to draw ground track plot of multiple spacecrafts onto a single texture map of a central body.
Warning
The longitude and latitude of a spacecraft is drawn as an approximation that includes straight line segments and longitude/latitude data does not takes into account central body shape or its oblateness.
Behavior When Specifying Empty Brackets in GroundTrackPlot's Add Field
When using GroundTrackPlot.Add field, if brackets are not populated with user-defined spacecrafts, then GMAT turns off GroundTrackPlot resource and no plot is generated. If you run the script with Add field having empty brackets, then GMAT throws in a warning message in the Message Window indicating that GroundTrackPlot resource will be turned off since no SpacePoints were added to the plot. Below is a sample script snippet that generates such a warning message:
          Create Spacecraft aSat aSat2
Create Propagator aProp
Create GroundTrackPlot aGroundTrackPlot

aGroundTrackPlot.Add = {}

BeginMissionSequence;
Propagate aProp(aSat, aSat2) {aSat.ElapsedDays = 1}
Examples
This example shows how to use GroundTrackPlot resource. A single spacecraft and a ground station is added to the GroundTrackPlot. Spacecraft’s ground track is plotted for one day of propagation:
          Create Spacecraft aSat
Create Propagator aProp

Create GroundStation aGroundStation

Create GroundTrackPlot aGroundTrackPlot
aGroundTrackPlot.Add = {aSat, aGroundStation}

BeginMissionSequence

Propagate aProp(aSat) {aSat.ElapsedDays = 1}
Propagate a spacecraft for two days around a non-default central body. Spacecraft’s ground track is plotted on planet Mars:
          Create Spacecraft aSat
aSat.CoordinateSystem = MarsJ2000Eq
aSat.SMA = 8000
aSat.ECC = 0.0003

Create ForceModel aFM
aFM.CentralBody = Mars
aFM.PointMasses = {Mars}

Create Propagator aProp
aProp.FM = aFM

Create CoordinateSystem MarsJ2000Eq
MarsJ2000Eq.Origin = Mars
MarsJ2000Eq.Axes = MJ2000Eq

Create GroundTrackPlot aGroundTrackPlot
aGroundTrackPlot.Add = {aSat}
aGroundTrackPlot.CentralBody = Mars

BeginMissionSequence

Propagate aProp(aSat) {aSat.ElapsedDays = 2}