


VLISP gives you almost unlimited access to symbols, values, and functions at any stage of program execution. The VLISP data inspection tools are implemented as modeless windows (except for the Symbol Service dialog box), meaning they stay on the screen as long as you need them, no matter what your program does.
- The Watch window displays the current value of any set of variables.
- The Trace Stack window displays the most current call hierarchy. At any level of the stack you can view the corresponding code, the calling code, the local variables, and more.
- The Symbol Service dialog box displays the current value of a symbol as well as its current flags. You can modify both the value and the flags from here.
- Inspect windows display any LISP object (from a string to an AutoCAD block definition) to any level of detail needed.
- Frame Binding windows display the values of all local variables for their particular stack frame (that is, the specific function invocation in the call sequence).
VLISP provides a logging feature that, when active, allows you to copy the contents of a Data Inspection window to a log file.
To turn trace logging on and off
- Activate the Trace window.
- Specify a log file by choosing
File
 Toggle Trace Log from the VLISP menu. Note that
if the Trace window is not active, the Toggle Trace Log option will
not be available.
Toggle Trace Log from the VLISP menu. Note that
if the Trace window is not active, the Toggle Trace Log option will
not be available. - Choose
Save to select the file you specified. If the file already exists,
VLISP prompts you with the following message:
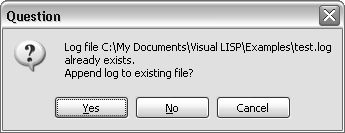
If you reply Yes, VLISP appends new data to the current contents of the file. If you reply No, VLISP overwrites the file and its original contents will be lost. Choose Cancel to terminate the operation and specify a different file name.
- To close the log file and quit the logging process, choose Toggle Trace Log from the File menu again.
When Trace logging is turned on, any information displayed in the Trace window is also written to the log file. Most VLISP data inspection tools provide a toolbar button for copying data to the Trace window.
The state of Trace logging is indicated in the Trace window's title bar. If logging is in effect, VLISP displays the name of the log file in the title bar. If logging is off, no file name appears in the title bar.
If you do not close the log file before exiting VLISP, it closes the file automatically upon exit. After a log file is closed, you can view its contents with any text editor, such as the VLISP text editor.