Correlation Analysis Method (System Identification Toolkit)
From LabVIEW System Identification Toolkit
Correlation Analysis Method (System Identification Toolkit)
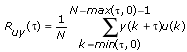
The correlation analysis method uses the cross correlation between the input and output signals as an estimation of the impulse response, as shown by the following equation:
![]()
The input signal must be zero-mean white noise with a spectral density that is equally distributed across the whole frequency range. The SI Estimate Impulse Response VI can prewhiten input signals that are not white noise.
Assuming the input u(k) of the system is a stationary, stochastic process and statistically independent of the disturbance e(k), the following equation is true.
![]()
Ruy represents the cross-correlation function between the stimulus signal u(k) and the response signal y(k), as defined by the following equation.
Ruu represents the autocorrelation of the stimulus signal u(k), as defined by the following equation.
![]()
N is the number of data points. If the stimulus signal is a zero-mean white noise signal, the autocorrelation function reduces to the following equation.
![]()
where σu is the standard deviation of the stimulus white noise and δ(τ) is the Dirac function. Substituting Ruu(τ) into the cross-correlation function between the stimulus signal u(k) and the response signal y(k) yields the following equation.
![]()
You can rearrange the terms of this equation to obtain the following equation defining the impulse response h(k).

Prewhitening
The correlation analysis method that estimates the impulse response is useful only when the input signal u(k) is a zero-mean white noise signal. However, the input signal is not white noise in most real-world applications. Therefore, you must precondition the input u(k) and output y(k) signals before you apply the correlation analysis method.
Prewhitening is a preconditioning technique for the correlation analysis method. Prewhitening involves applying a filter to the input signal u(k) and the output signal y(k) to obtain a prewhitened input signal u'(k) and a prewhitened output signal y'(k). If the filter is well designed such that u'(k) is white noise, you can perform a correlation analysis on u'(k) and y'(k) to estimate the impulse response. The impulse response that you estimate with u'(k) and y'(k) is equivalent to the impulse response that you estimate with u(k) and y(k) because the following equation remains true.
![]()
You now must design the prewhitening filter so that u'(k) is white noise. The SI Estimate Impulse Response VI uses an AR model for this purpose.
Accuracy of the Impulse Response
The accuracy of the impulse response estimation using the correlation analysis method depends on the performance of the prewhitening filter, specifically whether the filter produces a white noise result u'(k) for u(k). The performance of the filter depends on the signal and the AR order of the filter. The rule of thumb for selecting the AR order is trial-and-error. If u'(k) is not white enough, the result from the correlation method is not reliable. You can increase the AR order to improve the accuracy of the impulse response.
The SI Estimate Impulse Response VI provides the outputs whiteness test and rejected? to indicate whether you have properly set the AR order and consequently whether the impulse response estimation is reliable. The following example shows how the whiteness property of the input signal affects the correlation analysis method and how to use the outputs whiteness test and rejected? to justify the impulse response estimation.
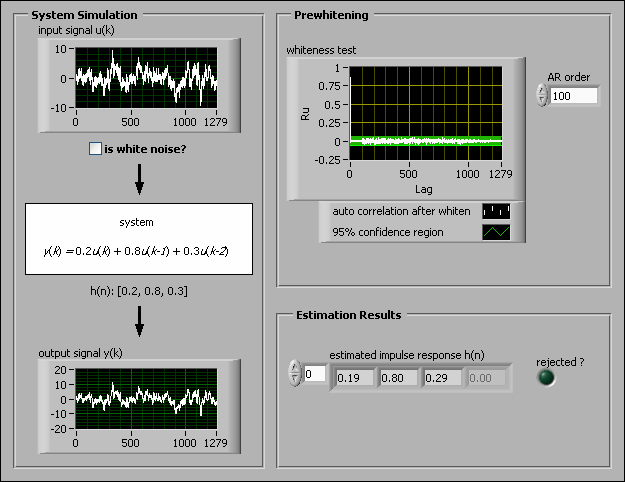
The following figure shows the front panel of a VI that simulates a system defined by the following equation.
y(k) = 0.2u(k) + 0.8u(k – 1) + 0.3u(k – 2)
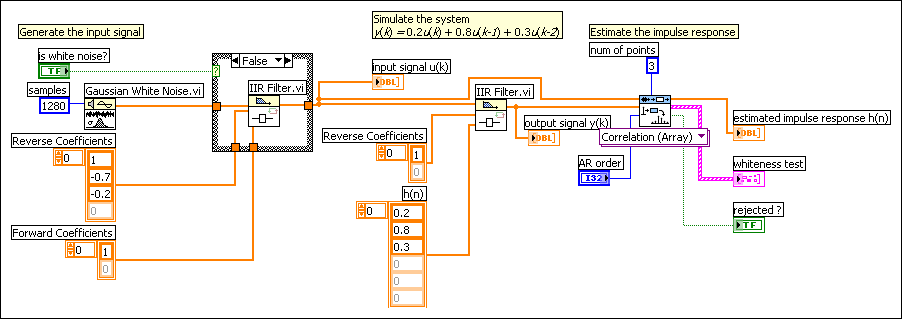
The following figure shows the block diagram of this VI. This example VI demonstrates the accuracy of the impulse response estimation in the following circumstances:
- Zero-mean, pseudo-white noise input signal without prewhitening
- Zero-mean, pseudo-white noise input signal with prewhitening
- Non-zero-mean, white noise input signal without prewhitening
- Non-zero-mean white noise input signal with prewhitening
In this example VI, the is white noise? checkbox determines whether the SI Estimate Impulse Response VI generates zero-mean white noise as an input to the system. When you place a checkmark in the is white noise? checkbox and run the VI, the generated input signal is zero-mean white noise, and the estimated impulse response closely approximates the true impulse response. When you do not place a checkmark in the is white noise? checkbox, the generated input signal is not zero-mean white noise. As a result, the estimated impulse response is different from the true impulse response. These results indicate that the correlation analysis method is accurate and reliable when the input signal is zero-mean white noise.
The AR order box determines the level of prewhitening. When AR order equals 0, the SI Estimate Impulse Response VI does not apply prewhitening to the system. When AR order is small and you do not place a checkmark in the is white noise? checkbox, the variance of the impulse response is large because the input signal is not always white noise. The greater the value of AR order, the better the VI whitens the signal, but the more computation time and memory the VI requires.
The whiteness test indicator of this VI shows whether the input is zero-mean white noise. This indicator displays the autocorrelation of the stimulus signal after whitening. If most of the autocorrelation is within the confidence region, the input signal is well prewhitened, and the estimation of the impulse response is reliable. If the autocorrelation is outside of the confidence region, the estimation is unreliable. When the estimation is unreliable, rejected? is TRUE and indicates a 5% risk of rejecting an impulse response estimation that might be reliable.
If you apply proper prewhitening, the correlation analysis method is accurate and reliable for any input signal. To obtain the best prewhitening settings, start with a small AR order value such as 2 and observe the whiteness test and rejected? outputs of the SI Estimate Impulse Response VI. If necessary, increase the value of AR order. Generally, the smaller the bandwidth of the input signal, the larger the AR order you need. However, avoid setting the value of AR order greater than 500.