Frequency Response (System Identification Toolkit)
Theoretically, the results from impulse response estimation and the results from frequency response estimation are equivalent. For example, the Fourier transform of the impulse response h(n), which you can compute using impulse response estimation, equals the frequency response G(ejω). However, this equivalence does not hold in most real-world applications because of different preprocessing schemes in impulse response estimation and frequency response estimation.
The frequency response provides the complete frequency-domain characteristics of the system, including the passband and the natural frequency of the system. A sinusoidal input signal has the following general form:
u(t) = sin(ω0t)
The response of a linear time-invariant system to a sinusoidal input also is a sinusoidal signal. However, the response to the sinusoidal input might have a different magnitude and phase than the sinusoidal signal, as shown in the following equation.
y(t) = bsin(ω0t + θ)
where b and θ are the magnitude and phase, respectively, of the frequency response of the system to an input sinusoidal frequency ωo. If you apply input signals with a number of sinusoids at different frequencies, you can obtain an estimate of the frequency response G(ω) of the system at those frequencies. The frequency response is a complex-valued sequence. The magnitude of G(ω) is the magnitude response of the system and the phase of G(ω) is the phase response of the system. This method of obtaining the frequency response is straightforward but takes a long time to complete and is sensitive to noise. For these reasons, the SI Estimate Frequency Response VI uses the spectral analysis method to estimate the frequency response function (FRF).
 |
Note You can use the SI Estimate FRF VI to estimate the FRF if you have only time-domain data available. |
Applications of the Frequency Response
The frequency response gives the characteristics of the system in the frequency domain. You can use the frequency response to obtain useful information before applying parametric estimation. For example, you can use the frequency response to determine whether you must pre-filter the signals or what the model order of the system is. You also can use nonparametric frequency response to verify parametric model estimation results by comparing the frequency response of the parametric model with the nonparametric frequency response.
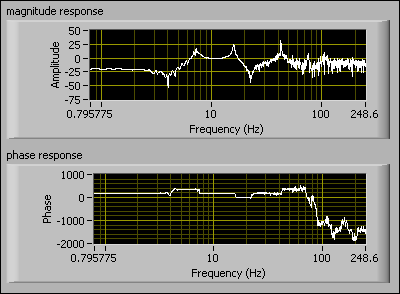
One example of a real-world application of the frequency response is with the flexible arm, as shown in the following figure. The input of this system is the reaction torque of the structure on the ground. This input is a multi-sine wave with 200 frequency points equally spaced over the frequency band from 0.122 Hz to 24.4 Hz. The output of this system is the acceleration of the flexible arm. The frequency response of this system is not significant outside of the range of interest, which is the frequency band of the input signal, or 0.122 Hz to 24.4 Hz. However, notice that the magnitude response has a peak around 42 Hz. The peak around 42 Hz may be the result of noise, or nonlinearity, or another input source. You can use lowpass filtering to remove the 42 Hz peak before applying parametric estimation.
