Estimating an ARX Model (System Identification Toolkit)
From LabVIEW System Identification Toolkit
Estimating an ARX Model (System Identification Toolkit)
One of the biggest challenges in model estimation is selecting the correct model and the order of the model. The LabVIEW System Identification Toolkit supports three different criteria to aid in the estimation of the order of a model.
- Final Prediction Error (FPE) Criterion
- Akaike's Information Criterion (AIC)
- Minimum Description Length (MDL) Criterion
Sometimes the results you obtain with these three criteria might be inconsistent. You can use a pole-zero plot for further investigation and to verify the results of the order estimation.
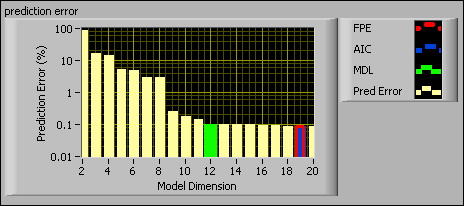
The following figure shows a prediction error plot generated by the SI Estimate Orders of System Model VI for an ARX model. The y-axis is the prediction error and the x-axis is the model dimension. The three different color bars on the chart represent the FPE, AIC, and MDL criteria.
You can use the AIC, MDL, and a user-defined criterion to determine the A and B orders of the ARX model.
Akaike's Information Criterion
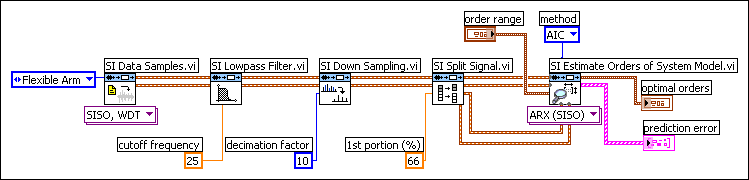
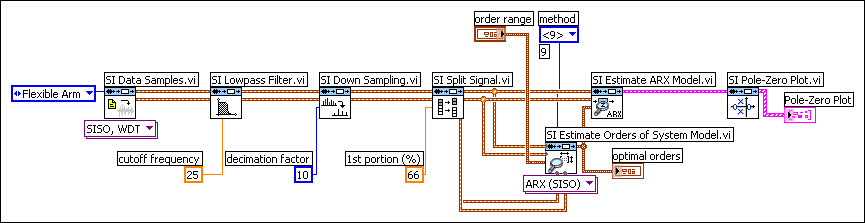
The following block diagram uses the SI Estimate Orders of System Model VI for order estimation. To estimate the orders of a model, the SI Estimate Orders of System Model VI requires two data sets—one for estimation and one for validation. You do not need to acquire two data sets from a system, rather, you can partition one data set into two using the SI Split Signals VI. The SI Split Signals VI divides the preprocessed data samples into a portion for model estimation and a portion for model validation.
In the following figure, the 1st portion (%) is 66, which means the SI Estimate Orders of System Model VI will use 66% of the data samples for estimation and the remainder of the data samples for validation.
The SI Estimate Orders of System Model VI generates the prediction error plot for the ARX model and the optimal A order and B order based on the AIC criterion. By using the AIC criterion, the lowest prediction error corresponds to a model dimension of 19, as shown in the prediction error plot. For an ARX model, the model dimension is equal to the sum of the A order, B order, and delay values. The SI Estimate Orders of System Model VI returns the following optimal orders:
- A order = 9
- B order = 10
- delay = 0
Verifying the Results
After determining the orders of the model, you want to verify the results to ensure the model accurately describes the system. One method is to plot a pole-zero map and visually inspect the plot to determine whether there is any redundancy in the data. If a pole and a zero overlap, the pole and zero cancel out each other, which indicates the estimated optimal order is too high.
The pole-zero plot graph in the following figure shows a pole-zero plot with three overlapping pole-zero pairs. Due to numerical error, it is unlikely that a zero and a pole perfectly overlap. You can use the confidence region to justify whether the pole and the zero cancel out each other.
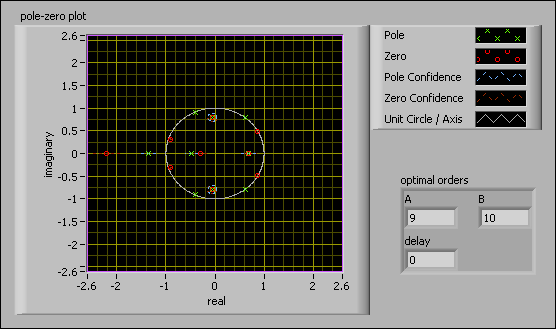
Because there are three pole-zero pairs, you can conclude that the AIC criterion does not produce the most optimal orders.
Minimum Description Length Criterion
Because the AIC criterion produced a model with non-optimal orders, you can try estimating the model orders with the MDL criterion. By using the MDL criterion, the lowest prediction error corresponds to a model dimension of 12, as shown in the prediction error plot. The SI Estimate Orders of System Model VI returns the following optimal orders:
- A order = 6
- B order = 6
- delay = 0
The following figure shows a pole-zero plot of a model with a model dimension of 12.

Compare the previous figure, which uses the MDL criterion and the figure which uses the AIC criterion. Because there are no overlapping pole-zero pairs in the previous figure, you can conclude that the MDL criterion fits better than the AIC criterion in this particular example.
In addition to examining redundancy, you also can use the pole-zero plot for other purposes. For example, both the previous two figures show poles outside the unit circle. Having poles outside the unit circle implies that this model is not optimal because the ARX system based on the AIC or MDL criteria is unstable. One way to stabilize the system is to change the order.
In addition to the FPE, AIC, and MDL criteria, you can set user-defined orders in the SI Estimate Orders of System Model VI.
User-Defined Criterion
If you know nothing about the system, you might have to rely on trial and error to determine the optimal orders of the model. However, if you have some knowledge about a system, you can customize the estimation to find a model that fits a certain model dimension. For this model, assume you know that the system is stable; therefore, no poles exist outside the unit circle. Because both the AIC and MDL criterion did not produce stable models, the model orders do not describe the system accurately.
On the following block diagram, you can customize the method parameter. Instead of AIC or MDL, you can select <Other> and enter the desired model dimension in the textbox. Assume you know that the model dimension is nine.
The following figure shows the corresponding pole-zero plot graph with a model dimension of nine, which corresponds to the following optimal orders:
- A order = 4
- B order = 5
- delay = 0
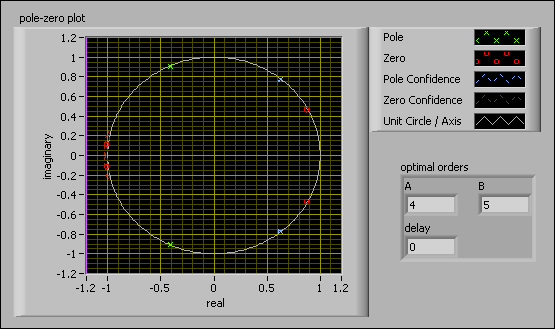
Compare the pole-zero plot in the previous figure with the previous two figures which uses the MDL criterion and the AIC criterion. The figure which uses the user-defined criterion has no overlapping pole-zero pairs and all the poles are within the unit circle. By visually inspecting the pole-zero plot, you can see that this model is stable and not redundant. Using these model orders, you now can estimate and verify the system model.