Validating the ARX Model (System Identification Toolkit)
The goal of model validation is to determine whether or not the estimated model accurately reflects the actual system. Using the model orders found in the User-Defined Criterion section, you can simulate and predict the response of the system. You can compare these responses to the actual response and determine the accuracy of the estimated model. You also can analyze the residuals to determine the accuracy of the estimated model.
Simulation and Prediction
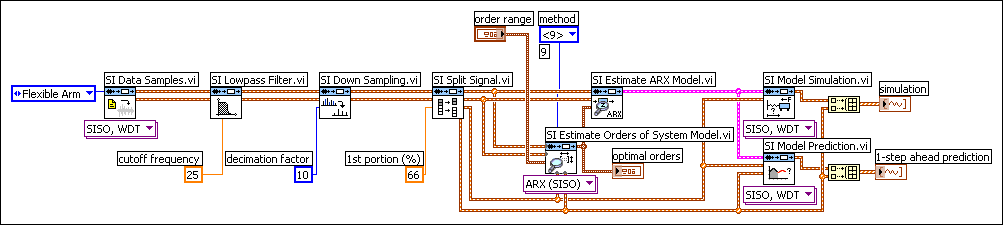
You can use the SI Model Simulation VI and SI Model Prediction VI to determine the accuracy of the estimated model. The SI Model Simulation VI simulates the system model and the SI Model Prediction VI performs a prediction of the system model. The results of the SI Model Prediction VI might differ from the SI Model Simulation VI because the SI Model Prediction VI periodically makes corrections to the estimated response based on the actual response of the system.
The following figure shows how you use these VIs to verify the ARX model created in the User-Defined Criterion section.
The simulation and 1-step ahead prediction graphs enable you to visually determine how accurate the model is. The following figure shows the results of the simulation and prediction as well as the actual response of the system.
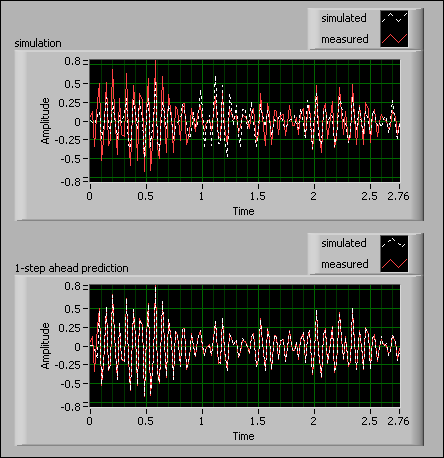
Notice how the actual response, or the measured response, is different from the simulated response in the simulation graph. The SI Model Simulation VI simulates the response of the system without considering the actual response of and the noise dynamics in the system.
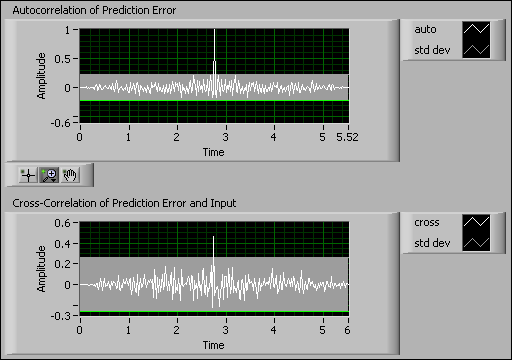
Residual Analysis
In addition to simulation and prediction, you can perform a residual analysis to validate the system model. Residual analysis tests whether the prediction error correlates to the stimulus signal. Prediction errors are usually uncorrelated with all stimulus signals in an open-loop system.
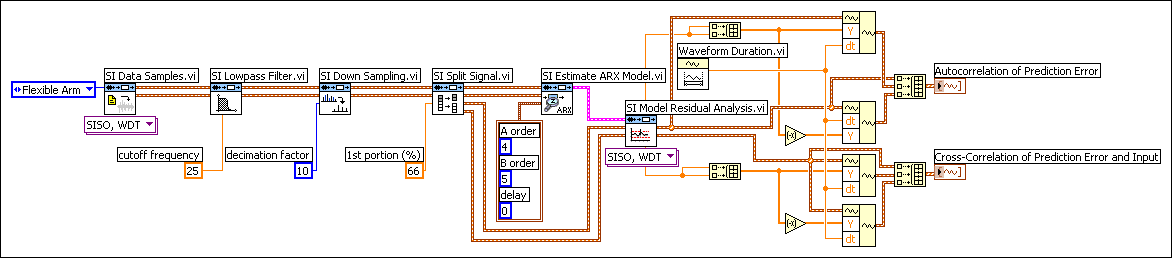
The following block diagram shows how you can use the SI Model Residual Analysis VI with the ARX model identified in the User-Defined Criterion section to analyze the residuals.
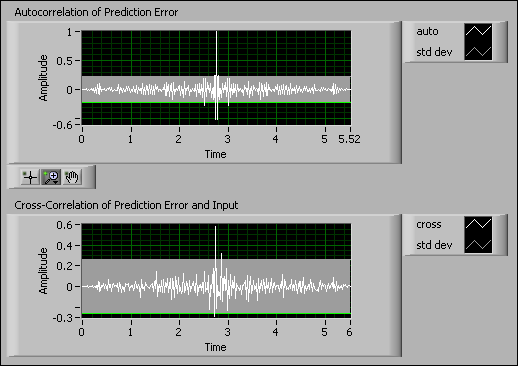
The following figure shows an example of ideal results where both autocorrelation and cross correlation are inside the confidence region except those in the vicinity of τ = 0. This result indicates that the estimated model accurately describes the system.
When you verify and validate the identified model, you must use multiple analysis techniques to determine if the estimated model accurately represents the system. Some analysis techniques can be misleading. For example, if you performed a residual analysis on the model identified in the Minimum Description Length Criterion section, you might conclude that this model is an accurate representation of the system. The following figure shows the autocorrelation and cross-correlation residual analysis for the model in the Minimum Description Length Criterion section. Recall that this model has the following orders:
- A order = 6
- B order = 6
- delay = 0
The previous figure shows that both the autocorrelation and cross correlation are inside the confidence region. Therefore, without performing any other analyses, you might conclude that this model is an accurate representation of the system. However, the pole-zero analysis in the Minimum Description Length Criterion section showed poles outside of the unit circle. So you already determined that this model is unstable. Thus, despite acceptable autocorrelation and cross-correlation values, concluding that this model is accurate is incorrect.
Thus, if you only performed a residual analysis, you might not discover that this model is actually unstable. When validating a model, perform multiple analyses to ensure the accuracy of the model.