Turing Debugger Guide
Introduction
Turing supports a number of tools to enable users to debug their programs and examine program execution. Some of the available tools are:- Stepping execution a line at a time.
- Tracing execution with a set pause between lines of execution
- Setting breakpoints to pause execution at specified points in the program.
- Viewing all open resources of a program including files, fonts, pictures, etc.
- View variables.
Displaying The Debugger Menu
In order to use any of the debugger commands, you need to have the Debugger menu showing in the Editor window. By default, the Debugger menu is hidden in order to simplify the Turing environment for the majority of students not using the debugger.There are two ways that the Debugger menu can be displayed. You can select the Show Debugger Menu command in the Run menu.
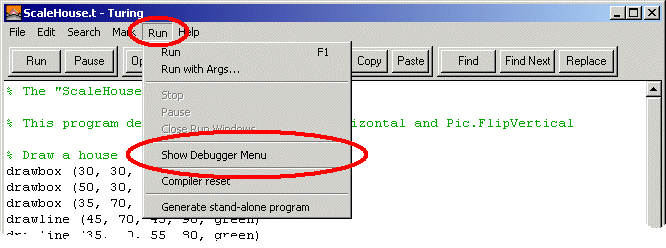 Show Debugger Menu command in the Run menu
If you are consistenly using the debugger, then you should change the Preferences so that the Debugger menu is always displayed. This can be done by bringing up the Editor Window pane of the Preferences dialog box and setting the Always Show 'Debugger' Menu check box.
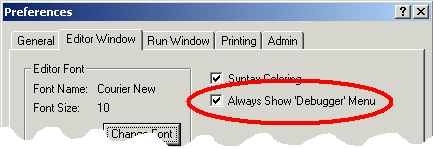
Always Show 'Debugger' Menu in the Editor Window Pane
Using The Debugger Menu
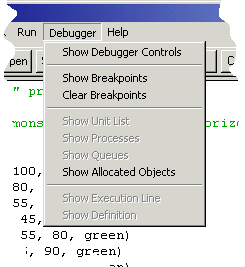
Show Debugger Menu command in the Run menu
The Debugger menu gives you access to all the debugging features in Turing 4.0. The following menu options are available:
- Show Debugger Controls
This command causes each Editor window to display a second row of controls at the top of the window (called the Debugger controls) that allow the user to step through a program and trace execution of the program. When the Debugger controls are visible, then this menu item changes to Hide Debugger Controls.
Window with Debugger Controls Visible - Show Breakpoints
This command causes each Editor window to dislay an area on the left
where breakpoints can be placed. A breakpoint is a marker that causes
the program to pause when execution reaches the marked line.
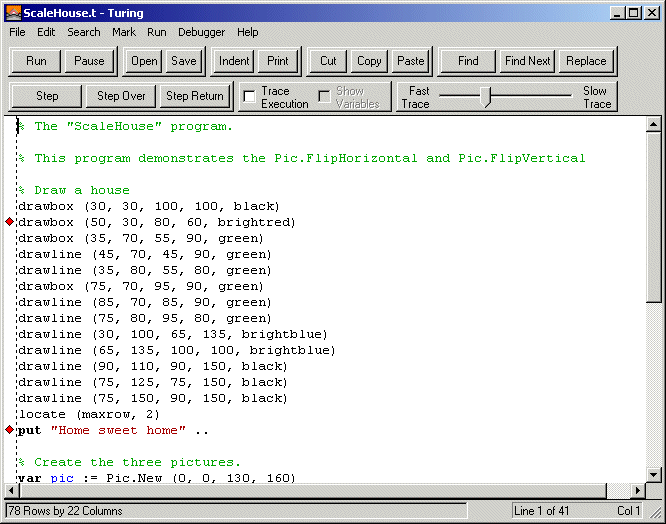
Window with Breakpoint Visible - Clear Breakpoints This command quickly eliminates all breakpoints that have been set in any Editor window.
- Show Allocated Objects
This command shows all the files, fonts, pictures, etc that have been
opened or created by the program but have not been closed. As the program
executes, this window updates every time a resource is allocated or freed.
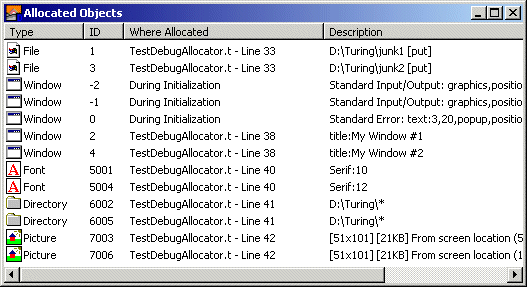
Allocated Objects Window
Turing Execution
The rest of this document will use some terms that must be understood properly.- Running - A Turing program is running when statements are being continuously executed without human intervention. However, running may be stalled while the program is waiting for keyboard input, executing a delay statement, etc.
- Paused - A Turing program is paused when execution is
temporarily halted. No input is accepted by the program while
it is paused. A program can become paused in a variety of ways including:
- The user pressing the Pause button.
- The user pressing a Step, Step Over or Step Return button.
- Execution reaching a breakpoint.
- Execution reaching the break statement in a program.
In each case, the program can resume running by clicking the Resume button. The program can also temporarily resume running by the user pressing the Step, Step Over or Step Return button. Once the statement or statements are finished running, the program is paused again. - Executing - A program is executing when it is either Running or Paused.
- Halted - A Turing program is halted when it can no longer
executing. It cannot be resumed and must be started from the beginning
in order to run it again. A program can be halted by:
- The user pressing the Stop button.
- A run-time error.
- The user closing a Run window.
Stepping a Program
Stepping a program consists of executing a Turing program a line at a time. After each step command, execution pauses, highlighting the next line to be executed. To step a program, the program must not be running. The Debugger controls in the Editor window must be visible. To step the program, the user clicks one of the three buttons in the Debugger Controls:- Step - If the program is halted, this executes the very first line of code and then pauses. If the program is paused, it executes the highlighted line of code and then pauses. If it line of code to be executed is a subprogram call, then it enters the subprogram and pauses at the first line of code in the subprogram. If it is at the end of the subprogram, then it leaves the subprogram and pauses at the subprogram call. This command is sometimes called Step Into.
- Step Over - This executes a single line of code. However, if the program is paused at a subprogram call, then the entire subprogram is executed and execution is paused at the next line after the subprogram call.
- Step Return - This resumes execution until the execution returns from a subprogram. The next line after the subprogram call. Note that if this command is given in the main program, then execution will continue until the program terminates.
Tracing a Program
Tracing a program is simply executing a program slowly with each line of code in the program being highlighted as it is executed. Tracing allows users to see how control constructs operate. Unlike stepping, with tracing, execution continues until it is paused or halted in some other fashion.To start a program tracing, the Debugger Controls must be visible. The user then clicks the Trace Execution check box. When the program is next running, each time a statement is executed, the line in the source code will be highlighted. The speed at which the tracing occurs is controlled by the Trace Speed slider found in the Debugger Controls. When the slider is on the left, there is essentially no delay between execution of statements. (Note that execution will still be much slower than not tracing due to the time taken to highlight each executing statement.) When the slider is on the right, each statement will wait for about 5 seconds after executing before the next statement is executed.
Setting Breakpoints
Often only a particular section of code is of interest to the user. Breakpoints provide a mechanism for pausing a program only when execution reaches a specified statement. To set breakpoints, they need to be displayed in the Editor window. This is done with the Show Breakpoints command in the Debugger menu. Once breakpoints are visible, they can be set (and removed) by simply clicking the mouse in the breakpoint area. When the mouse is over the breakpoint area, it turns into a diamond. When the breakpoint is set, a red diamond appears in the breakpoint area. To remove the breakpoint, simply click the red diamond and the breakpoint disappears.

Window with Two Breakpoints Set
When execution reaches a line with a breakpoint on it, the program pauses and the line is highlighted. The program can then be resumed or stepped as desired. Note that it is possible to set a breakpoint on a line that is not executed. If you place a breakpoint on a blank line, it is quite likely that execution will not stop. Likewise, in lines broken over multiple lines, it is best to put the breakpoint on the last line in the statement.
To clear all the breakpoints, select Clear Breakpoints from the Debugger menu.
Viewing Open Files/Pictures/Fonts, etc.
A common error in Turing programs is to neglect to close open files (using the Close statement) or free pictures or fonts (using the Pic.Free or Font.Free procedures). The Allocated Objects window displays all allocated resources until they are freed. This window is displayed by selecting the Show Allocated Objects command from the Debugger menu. The command can be given even after a program has halted. It is a useful command to use when am open, Pic.New or Font.New has failed because of too many open files, pictures or fonts.The window will also display just how much memory each picture takes up.

Allocated Objects Window
Clicking on the line containing the allocated object will highlight the line in the code where the object was allocated. The headings on each of the columns can be clicked allowing the objects to be sorted either by their ID, or by where in the program they were allocated.