Tracing
From RAMP-TS
Tracing
You can start tracing at any point in time during the execution of the Framework in design mode.
Use the Application Level trace facility to trace RAMP execution. To start tracing, click on the (Framework) menu, select (Tracing) -> Application Level.
Trace statements will appear in the Trace Window.
RAMP execution might produce a large number of statements. It will also produce long statements that will make it difficult to view in its entirety unless the window is enlarged.
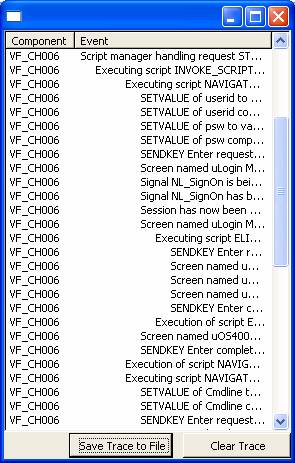
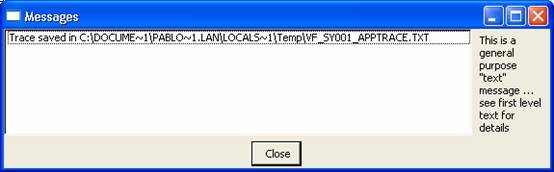
For RAMP execution tracing, we recommend to use the Save Trace to File button to save the trace into a text file in your temp directory. The exact location and file name of the trace file produced will appear in a message.
Press the Messages button to find out about the location of the trace file.
Adding Your Own Tracing Statements
The shipped Java Script function TRACE() allows you to add your own trace statements to the Application Level trace and the output of the trace statements is directed to the Application Level trace window.
For example, this trace statement:
TRACE("");
TRACE("Value of AKEY1 is =>" + objListManager.AKey1[0] + "<=");
TRACE("");
Generates this tracing:
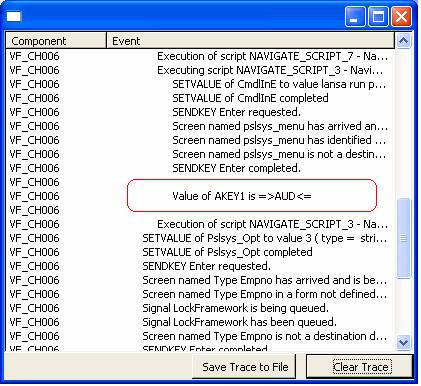
The blank lines before and after the actual trace statement are generated by TRACE(""); simply to make it easier to read.
For more information about the trace statement refer to Script Functions.