Printing Graphs
From WinFluor V4.0.3
Printing & Copying Graphs > Printing Graphs
Hard copies of graphs displayed in a plotting window can be produced by clicking on the graph plot (to ensure that it the active window) and selecting
FilePrint
To open the dialog box.
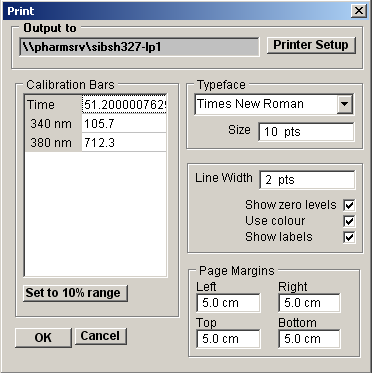
1. The printer selected for output is indicated in the Output to box and can be changed by clicking the Printer Setup button to open the Printer Setup dialog box.
2. The size and position of the graph on the page can be adjusted by changing the Left, Right, Top and Bottom page margin settings.
3. The typeface used to label the axes can be selected from the Typeface list and the size of the text set by the Size field. The thickness of the lines on the graph and the size of data point marker is set by the Line width and Marker size fields. Lines are printed in colour (as on the display screen) If the Use colour option is ticked.
4. Clicking the OK button plots the graph on the printer.