Time Course Window
From WinFluor V4.0.3
Recording > Images + Signals > Time Course Window
The Time Course Plots (Live) window displays the time course of the fluorescence intensity at a selected region of interest in the image and analogue signals.
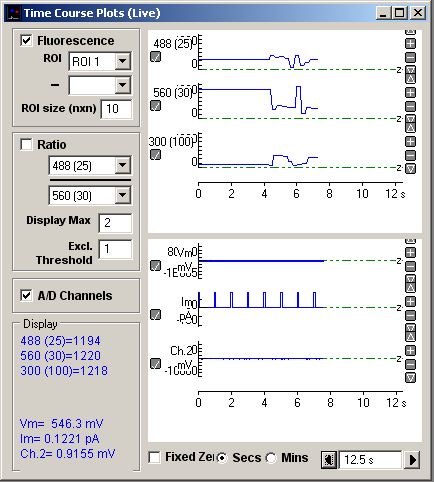
Fluorescence
Select the Fluorescence option to display the time course of the fluorescence intensity of a selected the region of interest (ROI.1 2 etc.) ROIs consist of n x n pixel square regions with the centred on the + marker on the image. The size of the ROI square is defined in the ROI size (nxn) box.
Initially, ROI.1 is defined and placed at the centre of the displayed image. It can be relocated within the image by moving the mouse pointer to the new location and double-clicking the mouse.
Up to 10 additional ROIs can be defined by clicking the Add ROI button which creates a new ROI at the current ROI.1 position. All ROIs (except ROI.1) can be deleted by clicking the Delete ROI button.
Once defined, the fluorescence intensity within the ROI can be selected for display in the time course plot by selecting it in Fluorescence ROI list. in the time course window. The difference between 2 ROIs can be plotted by selecting an ROI in the - ROI list.
Ratio
Select the Ratio option to display the time course of the ratio of intensities from a selected pair of wavelength image at the selected ROIs. The Display Max box sets the upper limit of the ratio display range. The Excl. Threshold box defines the minimum fluorescence signal level required for computation of a ratio. (If either of the two fluorescence signals fall below this value, the ratio is set to 0).
A/D Channels
Select the A/D Channel option to display analogue signal channels (if they are being acquired).
Display
The duration of the time course plot can be set by entering a value (in seconds) into the duration box at the bottom-right of the graph. Clicking the left and right arrow buttons halves and doubles the display duration.
The vertical magnification of each time course plot can be expanded to a selected region by moving the mouse to the upper limit of the region, pressing the left mouse button, drawing a rectangle to indicate the region and releasing the mouse button. The vertical magnification can also be adjusted using the + - buttons at the right edge of each plot.