Fluorescence Display
From WinFluor V4.0.3
Analysis > Event Detection & Analysis > Fluorescence Display
The Fluorescence Display options determines how the fluorescence signal is displayed: in terms of either the raw fluorescence intensity (in pixel grey scale units), the fractional change relative to a standard level, the ratio at two different wavelengths, or the computed ion concentration.
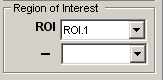
Region of Interest: The region of interest within the image from which the fluorescence signal is derived can be selected from the ROI list. A background fluorescence signal can be subtracted from the displayed signal by selected a background ROI from the - list. (not applicable to line scan files).
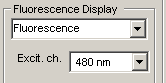
Fluorescence
Select the Fluorescence option to display the average fluorescence intensity signal computed over the selected ROI. If the file contains multiple excitation-wavelength channels, select the required wavelength from Excit. Ch. list.
Fluorescence dF/F0
Select the Fluorescence dF/F0 option to display the fluorescence signal as a fraction of a predefined baseline fluorescence level (F0).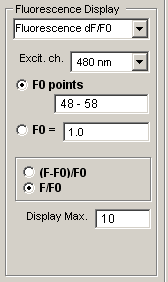
Select the F0 frame option to define the baseline fluorescence level as the average fluorescence between the range of frames defined in the adjacent range box, or select the F0= option and enter the value into the F0= box. Select the (F-F0)/F0 option to plot the fractional difference relative to F0 or F/F0 to plot the fraction of F0. Enter the upper limit of the display range into the Display Max. box.
Fluorescence ratio
Select the Fluorescence ratio option to the display fluorescence ratio of two wavelengths (only available for multi-wavelength image files).
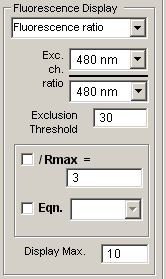
Select the wavelengths to be ratioed from the Exc. ch. ratio wavelength selection lists. Enter the lowest acceptable intensity level for the denominator wavelength in the Exclusion Threshold box. (Ratios with denominators below this level are set to zero.) To display the ratio as a fraction of a maximum ratio, tick the /Rmax= option and enter the maximum in the /Rmax= box. To display ion concentration computed from the fluorescence ratio, tick the Eqn. option and select an equation.