Viewing Image Recordings
From WinFluor V4.0.3
Viewing/Measuring Recorded Images > Viewing Image Recordings
To open and view a WinFluor data file containing a series of stored images & signals, select
FileOpen Data File
to open the Open Data File dialog box, then select the required (*.IDR) file.

A graph of the time course of pixel intensity from a selected region of interest (ROI) within the displayed image (one for each image pane in multi-wavelength sequence) is displayed in the time course window. Analogue signals (if they have been acquired) are also displayed in this area.
Display Calibration Bar
Checking this option displays a calibration bar at the bottom-left of each display pane. (The size of the calibration bar and lens magnification from which it is derived is defined in the Camera Settings dialog box.)
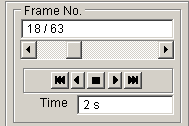
Selecting/displaying frames
Individual image frames can be selected for display using the frame selection slider bar or by directly entering the required frame number into the Frame No. display box. Frames can be played forwards and backward in sequence using the playback control buttons.
The Zoom option can be used to magnify or reduce the region of the image displayed within the image panel.
Zoom factors of 25% - 800% are currently supported. The magnified region of the image displayed within the image panel can be panned horizontally and vertically within the image.
Adding markers
Marker text can be added to each image by entering text into the marker text box and clicking the Add Marker button. The marker text appears at the bottom-right of the image and also on the time course plot. Up to 20 marker text labels can be added to each file. (Marker text can also be edited by opening the data file Properties box (File/Properties) and editing the text in the Markers table.