Viewing Line Scan Recordings
From WinFluor V4.0.3
Viewing/Measuring Recorded Images > Viewing Line Scan Recordings
To open and view a WinFluor data file containing a series of stored line scan images & signals, select
FileOpen Data File
to open the Open Data File dialog box, then select the required (*.IDR) file.
The line scans time series is displayed in the top panel of the View Line Scans windows with the line oriented vertically and time horizontally. For multi-wavelength files containing more than one line scan image acquired at different emission wavelengths, the displayed line scan image can be selected from the Line Scan list.
![]()
A graph of the time course of pixel intensity from a selected point (TC) on the line is displayed in a time course plot below the image. Analogue signals (if they are being acquired) are also displayed in the analogue signal plot.
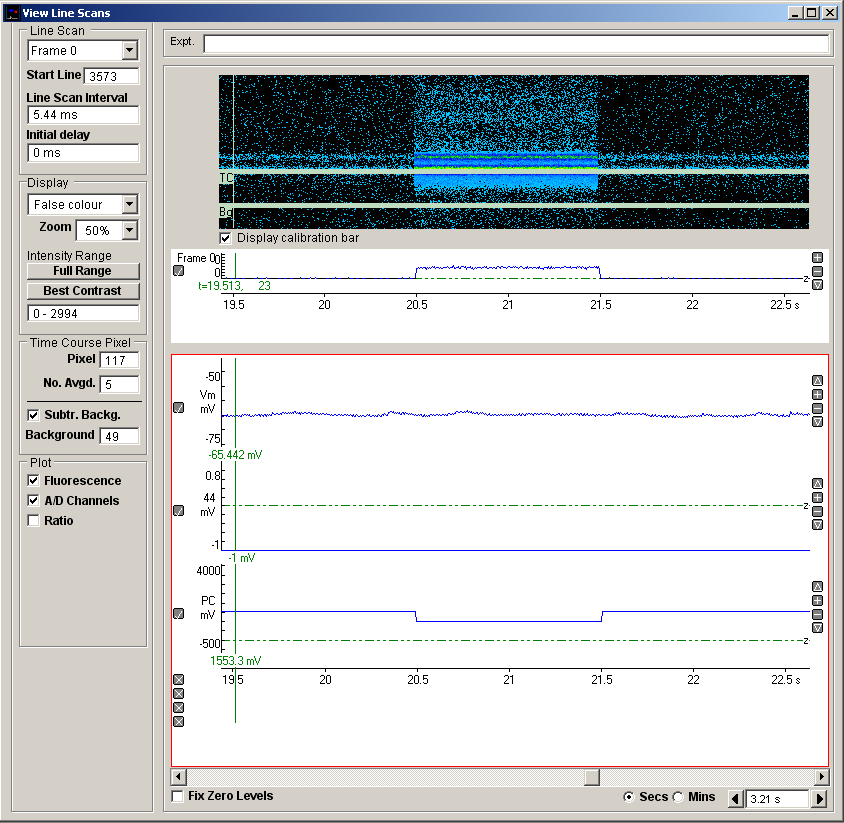
Display Calibration Bar.
Checking this option displays a calibration bar at the left edge of the line scan image.