Time Course Analysis
From WinFluor V4.0.3
Analysis > Time Course Analysis > Time Course Analysis
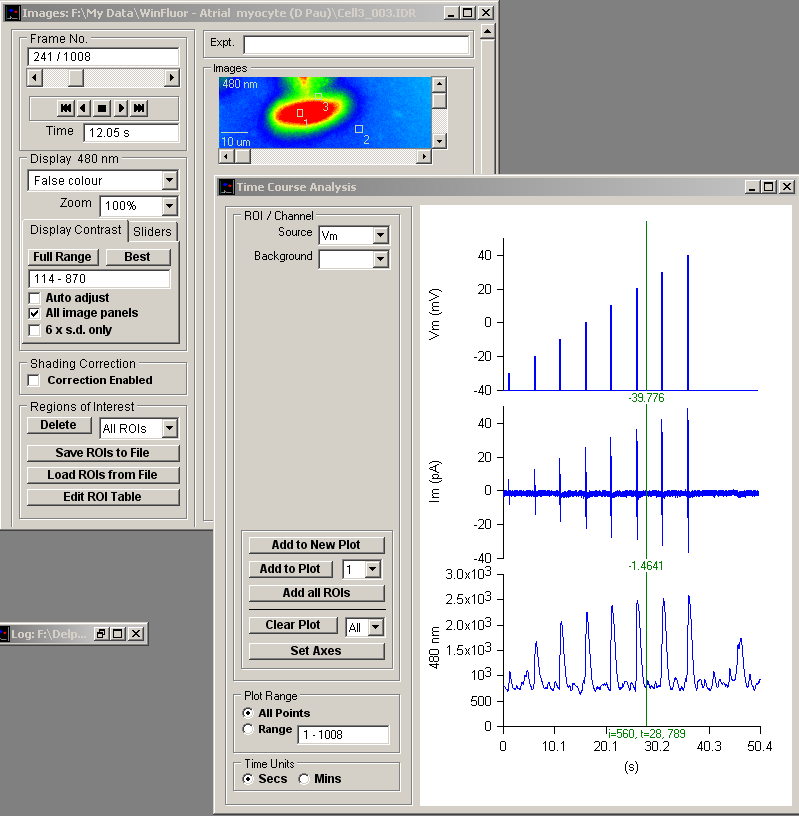
The time course analysis window plots graphs of the time course of the mean image intensity within the regions of interest defined in the Images window. Relative changes in intensity (F/F0 ratios) can be computed and also intensity ratios and ionic concentration plots for multi-wavelength recordings.
Select
AnalysisTime Course Analysis
to open the time course analysis window.