Averaging Events
From WinFluor V4.0.3
Analysis > Event Detection & Analysis > Averaging Events
Series of detected events can be combined into a single ensemble average event, by averaging corresponding fluorescence and analogue sample points, lined up relative to the detection point.
To average a series of events:
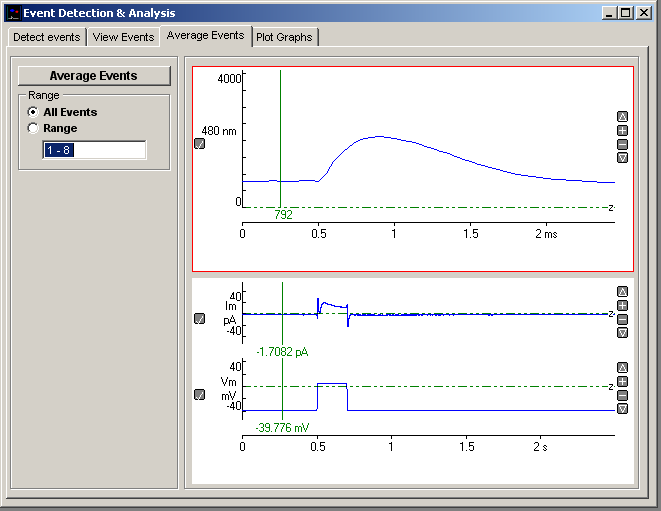
1. Select the Average Events page of the Event Detection & Analysis window.
2. Select the range of events to be averaged either by select All Events OR by selecting Range and entering the range of events. (Note. Events marked as Rejected are not included in the average.)
3. Click the Average Events button.
Displayed traces can be printed (File / Print Graph) or copied to the Windows clipboard as data (Edit / Copy Graph Data) or as an image (Edit / Copy Graph as Image). (A plot is selected for printing/copying by clicking on it. Selected plot is outlined in red.)