Plotting Fluorescence Time Course at Selected Wavelengths
From WinFluor V4.0.3
Analysis > Spectral Analysis > Plotting Fluorescence Time Course at Selected Wavelengths
To display the time of intensity at selected regions of interest:
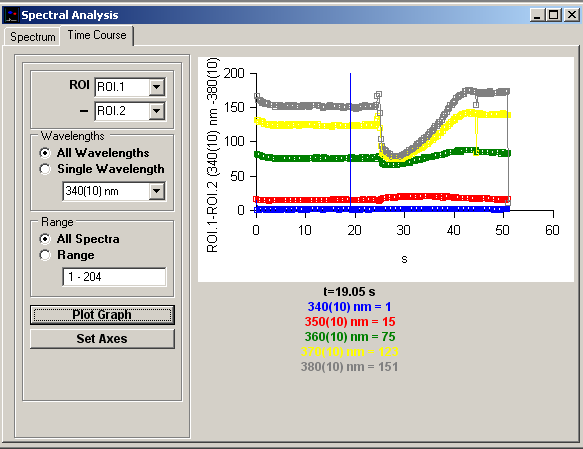
1. Select the Time Course page in the Spectral Analysis window.
2. Select a region of interest for plotting in the ROI list and (optional) a background region to be subtracted in the - list .
3. Wavelengths: Select the All Wavelengths option to plot the time course for all wavelengths in the spectrum or Single Wavelength and select a single wavelength from the list.
4. Range: Select the All Spectra option to include all spectral time points in the plot or select Range and enter a selected range of spectra within the file.
5. Click the Plot Graphs button to plot the time course(s).
6.
The displayed graph can be printed (File / Print Graph) or copied to the Windows clipboard as data (Edit / Copy Graph Data) or as an image (Edit / Copy Graph as Image).