Displaying a Line Profile
From WinFluor V4.0.3
Analysis > Line Profile > Displaying a Line Profile
The line profile module plots image intensity along the length of a linear ROI defined within an image stored on file. It can oper
Select
AnalysisLine Profile
to open the Line Profile display window.
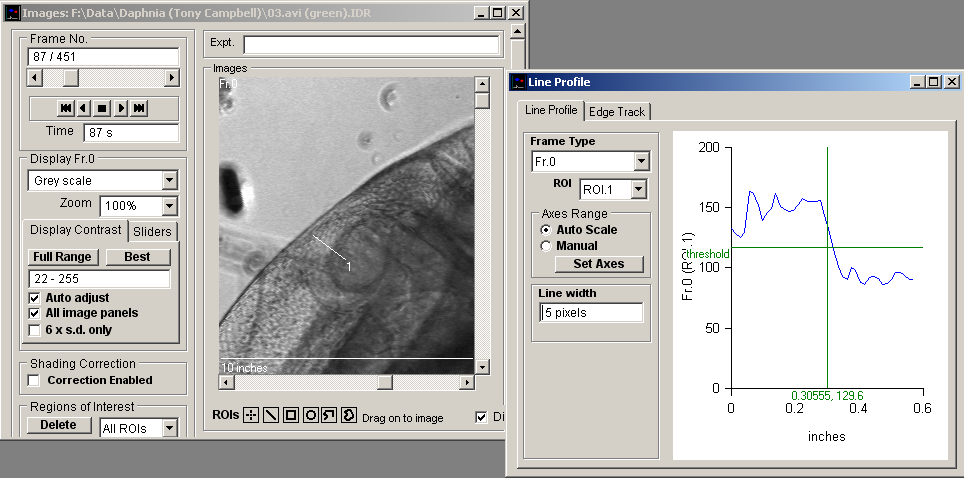
To display a line profile:
1. Define a Line ![]() or multi-segment line
or multi-segment line ![]() ROIs within the image displayed in the Images window.
ROIs within the image displayed in the Images window.
2. Frame Type: If the file contains multi-wavelength images, select the wavelength to be displayed from the Frame Type list.
3. Select the region of interest from the list of available ROIs displayed in the ROI list.
4. Line Width: Define the number of pixels (at right angles to each pixel point on the line) to be averaged to produce the line profile in the Line Width box.
5. Axes Range: Select the Auto Scale option to automatically scale the plot axes range or Manual to specify a fixed range, define using Set Axes.
The displayed plot can be printed (File / Print Graph) or copied to the Windows clipboard as data (Edit / Copy Graph Data) or as an image (Edit / Copy Graph as Image).