Export Measurements 
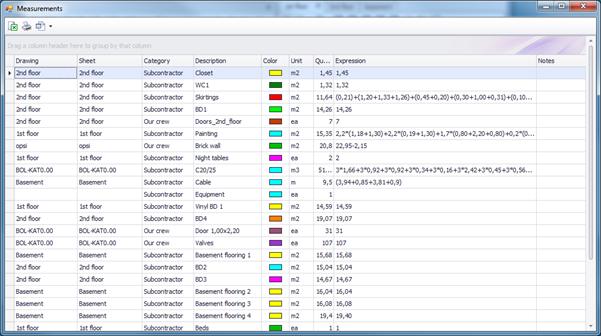
This button allows you to export the primary measurements to a table. Then, you can change the table’s appearance before its final export to Excel.
This table shows all measurement details in the following columns: 'Drawing', 'Sheet', 'Category', 'Description', 'Color', 'Unit', 'Quantity', 'Expression', 'Notes'.
Using the advanced filtering, grouping, column selection, and sorting tools, you have many options of setting the number, the form, and the type of the data you wish to view (See Appendix/Filters/Sorting).
Using the ‘Measurements analysis’ button  you can preview and print the analysis of
the measurements in the above list. The analysis includes dimensions marking and
details of surface area calculations (See Measurement analysis).
 The ‘Measurements
analysis’ button is also present at the drawings window toolbar and gives
similar results (See Drawing windows/Measurement analysis
  ). The difference is that, the
analysis obtained from this window takes into account the sub-measurements and
individual shapes, if any, of each measurement. If for example the continuation
of a measurement is interrupted twice (by addition or subtraction), then three
sub-measurements appear in different rows and for each one of them a separate
page is created.
 Using the filters
you can set criteria to limit the number measurements that appear in the list
and subsequently the measurements that will be included in the analysis.
Exporting measurements and work items can be done from the ‘WBS’ tab where these features are described in detail (See Work items/Exporting WBS/Export WBS measurements).
