Home > Analysis Module > Using a PivotTable in Excel to browse an OLAP cube
Using a PivotTable in Excel to browse an Analysis Module cube
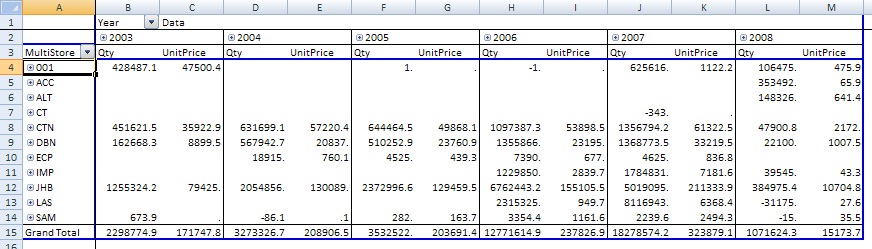
Use Microsoft Excel to create a link to your Analysis Module cube report, by using an Excel Pivot Table to browse the cube and define the layout as you would like to see it in an Excel pivot table.
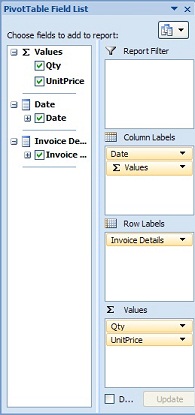
The dimensions and measures that you used to create your .cub file are available on the Pivot table field list when you have run your report into Excel.
Using Excel as your cube browser allows you to drag and drop the fields defined in your cube to view the same data in various ways. If you get to a point where a specific layout that you have created serves a specific need in your business and you want to keep this layout, you can do this by creating and linking your Excel layout with the cube report you created in the Sage Accpac Intelligence Report Manager. Consequently, each subsequent time you run your cube report after doing a create and link process, your most recent Excel layout will automatically be displayed.
You are now able to perform data analysis on the data in the .cub file.