Narrowband FIR Filters (Digital Filter Design Toolkit)
The order of a finite impulse response (FIR) filter is related inversely to the transition bandwidth. Conventional FIR filters with narrow transition bands and high orders might be too complex to implement. You might consider designing narrowband filters using infinite impulse response (IIR) filters. However, narrowband IIR filters typically have nonlinear phase, especially near the transition band, and are numerically sensitive. You might be able to meet the target filter specifications by using narrowband FIR filters instead of using IIR filters.
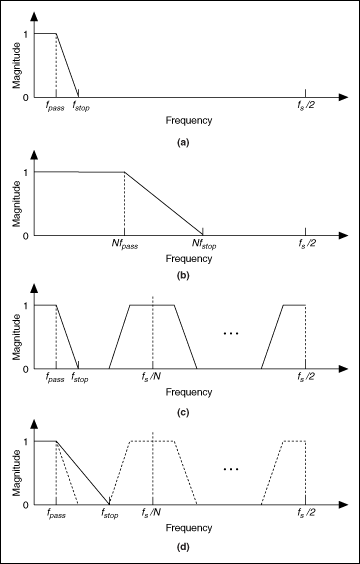
The DFD Narrowband Filter Design VI uses interpolated FIR (IFIR) techniques and frequency response masking techniques to design narrowband FIR filters with significantly less computational complexity than conventional FIR solutions, as shown in the following figure:

|
(a) Frequency response of the target narrowband FIR filter H(z) |
|
(b) Frequency response of a shaping filter G(z) |
|
(c) Frequency response of an interpolated filter G(z N) |
|
(d) Frequency response of a masking filter I(z) |
To better understand how these techniques work, assume that the target narrowband filter has the frequency response shown in part (a) of the previous figure. The first step is to design a shaping filter as shown in part (b). The shaping filter has a wider transition band than the target narrowband filter and determines the spectrum shape of the target narrowband filter. The next step is to design an interpolated filter with the frequency response shown in part (c). Notice that the coefficients of the interpolated filter G(zN ) are constructed by inserting N−1 zeroes between every two adjacent coefficients of G(z). The magnitude response of the first image of G(zN ) in part (c) is the same as that of the target filter H(z) in part (a). To remove the unwanted images of G(zN ), you need to cascade the interpolated filter G(zN ) with a masking filter I(z), which has the magnitude response shown in part (d).
By cascading the interpolated filter G(zN ) and the masking filter I(z) as illustrated in the following figure, you can obtain the target narrowband filter H(z).

This figure shows a two-stage narrowband filter structure. Because I(z) and G(z) have a much wider transition band than the original filter H(z), the overall order of I(z) and G(z) is lower than the order of H(z), which makes the cascaded filters computationally efficient.
Similarly, if the lowpass masking filter I(z) also is a narrowband filter, you can make it more efficient by using the two-stage narrowband filter structure. The following figure illustrates the diagram of the resulting three-stage structure. This figure uses a cascaded integrator comb (CIC) filter as the first-stage lowpass masking filter in this case because of the lowpass nature and efficient implementation.

Assume a signal with a sampling frequency of 5 kHz. The signal has useful information at frequencies below 100 Hz and noise above 120 Hz. To suppress the noise, you can apply a narrowband lowpass filter with the following specifications:
| Specification | Value |
|---|---|
| Passband Range | 0−100 Hz |
| Passband Ripple | 0.05 dB |
| Stopband Range | 120−2500 Hz |
| Stopband Attenuation | 60 dB |
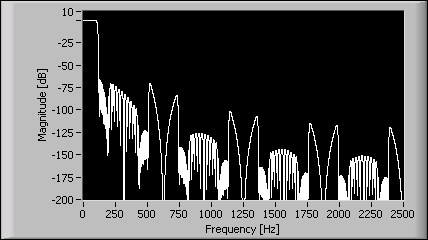
If you design the lowpass FIR filter using the DFD Remez Design VI, the resulting filter has 689 taps. Given the same specifications, the DFD Narrowband Filter Design VI generates a three-stage narrowband filter. The resulting CIC filter has 5 stages, the interpolated filter F(zM ) has 18 nonzero coefficients and the interpolated filter G(zN ) has 27 nonzero coefficients. The CIC narrowband filter is 78% less computationally complex than the lowpass FIR filter you design using the DFD Remez Design VI. The following figure shows the magnitude response of the designed narrowband filter.

To plot the frequency response of narrowband FIR filters, use the DFD Plot Narrowband Freq Response VI. To perform narrowband filtering, use the DFD Narrowband Filtering VI.