Debugging
"Debugging" is a term used in computer programming which means to remove or fix mistakes in your program. These mistakes are called "bugs" because a very long time ago, when computers used actual "thing" like valves to work (rather than a chip) someone once found an actual insect in their computer which was causing it to work in an odd manner.
BASin provides many ways to help debug your programs. Debugging is the process by which you determine where a program is not doing what it should, and narrow down the exact "fix" needed to get it working properly. Most of the time, this is due to an error on the your part - a spelling error, or a misunderstanding of how certain codewords do their jobs.
This chapter deals with the methods you can use to track down bugs, and fix them. All of these are ways to get information about your program and its variables as the program is running. By watching this information and following your code slowly, you can (hopefully) get an idea of what is going wrong.
There is one thing worth mentioning - the more debugging systems you enable, the slower a program will execute. BASin will have to take time away from the emulation of the Spectrum BASIC in order to update the various sources of information you have asked for, which can result in choppy sound and inconsistent program speed even on the fastest of systems.
Stepping and tracing
One of the most simple debugging tools is the Program Trace. This can be enabled from the Run Menu in the Editor, and will update the editor window as statements execute in real time. This is quite fast and lines flash by very quickly, but some people find that it's necessary to be able to "watch" how their program runs.
Another good method to use is to pause the operation of your program, without actually stopping it. Your program won't know that it's stopped, so it won't affect it.
This can be useful - once the program is "halted" then you can step through the code one statement at a time, and monitor the program flow and variables as you do. BASin provides three methods of doing this:
- Single Stepping which will advance one line at a time - each statement will be executed and then control will be returned to the user with the program halted once more.
- Step Over which will run emulation until the next statement is ready to run. Although on the surface this looks very much like Single-Stepping, the difference can be seen when you step over a GO SUB statement. The entire subroutine will be executed as normal, and the program halted when the subroutine RETURNs.
- Run To which will allow the program to run until the line that the editor cursor is currently resting on is ready to execute.
For more information, see the Run menu.
Breakpoints
The user can suspend operation using the Run Menu in the Editor, but you'd be hard pressed to accurately stop just where you want to. This is where Breakpoints and Watches come in very handy indeed.
At their simplest, breakpoints are "flags" attached to a statement which, when the statement is about to be executed, tell the emulation to suspend operations and return control to the user. You can then use the various other tools to examine what is going on - look at variables, for instance.
Breakpoints in the editor show up as a red bar on a statement:
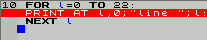
Breakpoints in BASin can get a lot more complex than this, however.
You can create a breakpoint by simply double-clicking a statement in the Editor. However, if you open the Breakpoints Window, you can get advanced properties of the breakpoint and attach conditions and logging options to it. With a condition attached, you can tell BASin to suspend program operation only when that condition evaluates to "true", or a non-zero result. This is for more advanced users, and can be confusing to the beginner.
The condition is simply an expression. Whenever that statement is due to be executed, the condition is evaluated, and if a non-zero result obtained then execution is suspended. Similarly, a log of the breakpoint can be added to the Log Window, the text of which is also an expression, which returns a string result. For instance, you can add a log to a breakpoint which sends the contents of a variable to the Log Window. This can be useful for tracking the state of a variable as the program executes - the breakpoint does not always have to suspend execution.
Watches
Watches are another type of debugging tool, loosely related to breakpoints, but much more flexible. They are a list of expressions (or other types of data, such as variable contents, system variable states, memory states etc) which are updated after every statement executes. The Watch Window is constantly updated as the program runs, to reflect the state of these watches.
Watches may have conditions as well. The program halts when the value of the expression satisfies the condition.
- To create a watch, use the Add Watch window.
- To view the values of watches, or delete them, use the Watch List window.
Alternatively, you can watch variables - and edit their values - in the Variables window and System Variables window.
See also: