It supports only Keyboard inputs, replying to any touch screen events with the message: CH_MSG_SELECTED.
The Chart Object is rendered using the assigned style scheme. The following figure illustrates the color assignments.
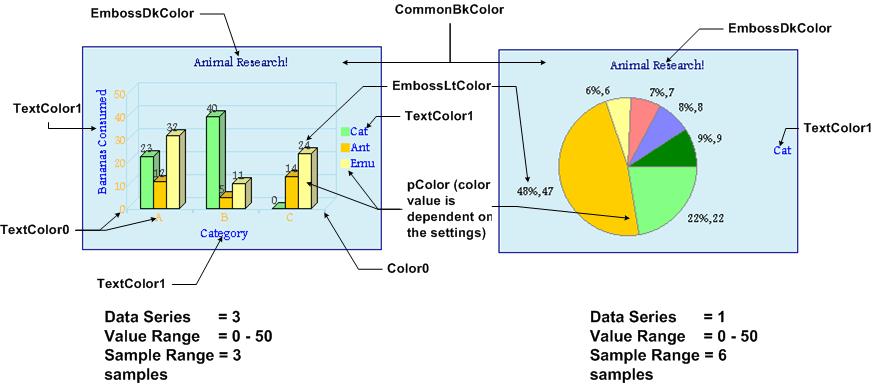
Chart Terminologies
- Value Axis - This is the vertical range of a chart for normal bar charts and horizontal range of the chart for horizontally drawn bar charts. In most cases this axis will represent values ($ amounts), temperatures, or other numeric data.
- Sample Axis - This is the horizontal range of a chart for normal bar charts and vertical range of the chart for horizontally drawn bar charts. In most cases this axis will represent categories, such as months, sample segments, or other non-numeric data.
- Title - The text used to define the Title of the chart.
- Data Points (or the sample points) These are the individual points where a value is graphed, as a point on a line, a bar, or a pie slice.
- Data Series - A complete series of data, distinguished by the same color and type of sample point.
- Legend - Labels that indicate how each data series is displayed on the chart. Each color represents a different data series. For pie charts with only one data series shown, each color represents one sector or one sample point.
- Data Sample Range - The scale for the data sample axis. Example: months from January to December. Internally, this range is represented by:
- Numeric Sequence 1, 2, 3, ... and so on
- Alphabet Sequence A, B, C, .. and so on.
- Value Range - The scale for the value axis. Example: range of numbers from the lowest to the highest to be charted.
Functions
|
|
Name |
Description |
 |
This function creates a CHART object with the parameters given. It automatically attaches the new object into a global linked list of objects and returns the address of the object. | |
|
|
This function renders the object on the screen using the current parameter settings. Location of the object is determined by the left, top, right and bottom parameters. The colors used are dependent on the state of the object. The font used is determined by the style scheme set. The colors of the bars of the bar chart or sectors of the pie chart can be the default color table or user defined color table set by ChSetColorTable() function. When rendering objects of the same type, each object must be rendered completely before the rendering of the next object is... more | |
|
|
This function creates a DATASERIES object and populates the structure with the given parameters. | |
|
|
This function removes DATASERIES object from the list of DATASERIES objects and frees the memory used of that removed object. The position of the object to be removed is specified by the number parameter. If the list has only one member, it removes the member regardless of the number given. | |
|
|
This function sets the minimum and maximum range of values that the bar chart will show. The criteria is that min <= max. | |
|
|
This function sets the minimum and maximum range of percentage that the bar chart will show. The criteria is that min <= max. This affects bar charts only and CH_PERCENTAGE bit state is set. | |
|
|
This function sets the sample start and sample end when drawing the chart. Together with the data series' SHOW_DATA flags the different way of displaying the chart data is achieved. | |
|
|
This function removes DATASERIES object from the list of DATASERIES objects and frees the memory used of that removed object. | |
|
|
This function evaluates the message from a user if the message will affect the object or not. The table below enumerates the translated messages for each event of the touch screen and keyboard inputs. |
Macros
|
Name |
Description |
|
This macro sets the specified data series number show flag to be set to SHOW_DATA. | |
|
This macro sets the specified data series number show flag to be set to HIDE_DATA. | |
|
This macro shows the number of data series that has its show flag set to SHOW_DATA | |
|
This macro returns the show ID status of the DATASERIES. | |
|
This macro sets the address of the current text string used for the value axis label of the bar chart. | |
|
This macro returns the address of the current text string used for the value axis label of the bar chart. | |
|
This macro returns the current maximum value that will be drawn for bar charts. | |
|
This macro returns the current minimum value that will be drawn for bar charts. | |
|
This macro gets the current range for bar charts. The value returned is calculated from the current (valMax - valMin) set. To get the minimum use ChGetValueMin() and to get the maximum use ChGetValueMax(). | |
|
This macro sets the address of the current text string used for the sample axis label of the bar chart. | |
|
This macro returns the address of the current text string used for the sample axis label of the bar chart. | |
|
This macro returns the sampling start value. | |
|
This macro returns the sampling end value. | |
|
This macro gets the percentage range for bar charts. The value returned is calculated from percentage max - min. To get the minimum use ChGetPercentMin() and to get the maximum use ChGetPercentMax(). | |
|
This macro gets the sample range for pie or bar charts. The value returned is calculated from smplEnd - smplStart. | |
|
This macro returns the current maximum value of the percentage range that will be drawn for bar charts when CH_PERCENTAGE bit state is set. | |
|
This macro returns the current minimum value of the percentage range that will be drawn for bar charts when CH_PERCENTAGE bit state is set. | |
|
This macro sets the color table used to draw the data in pie and bar charts. | |
|
This macro returns the current color table used for the pie and bar charts. | |
|
This macro sets the address of the current text string used for the title of the chart. | |
|
This macro returns the address of the current text string used for the title of the chart. | |
|
This macro sets the location of the font used for the title of the chart. | |
|
This macro returns the location of the font used for the title of the chart. | |
|
This macro returns the location of the font used for the X and Y axis labels of the chart. | |
|
This macro sets the location of the font used for the X and Y axis labels of the chart. | |
|
This macro returns the location of the font used for the X and Y axis grid labels of the chart. | |
|
This macro sets the location of the font used for the X and Y axis grid labels of the chart. |
Structures
|
Name |
Description |
|
Defines the parameters required for a chart Object. | |
|
Defines a variable for the CHART object. It specifies the number of samples, pointer to the array of samples for the data series and pointer to the next data series. A member of this structure (show) is used as a flag to determine if the series is to be drawn or not. Together with the smplStart and smplEnd it will determine what kind of chart will be drawn. | |
|
Defines the parameters for the CHART object. |
Topics
|
Name |
Description |
|
List of Chart bit states. | |
|
Data Series show status flag settings. | |
|
Examples of generated bar charts based on settings. | |
|
Default color table used to draw data points in a chart. |
Links